





RovantraTiming
Available now · 3-day free trial

Live timing, set up around your engineers.

Rovantra Timing reads the Natsoft feed and comes configured to simplify the engineer's workflow. Every display is ready to use, and every one can be fine-tuned and made your own. Start on one laptop, then give each screen on your data station its own layout.

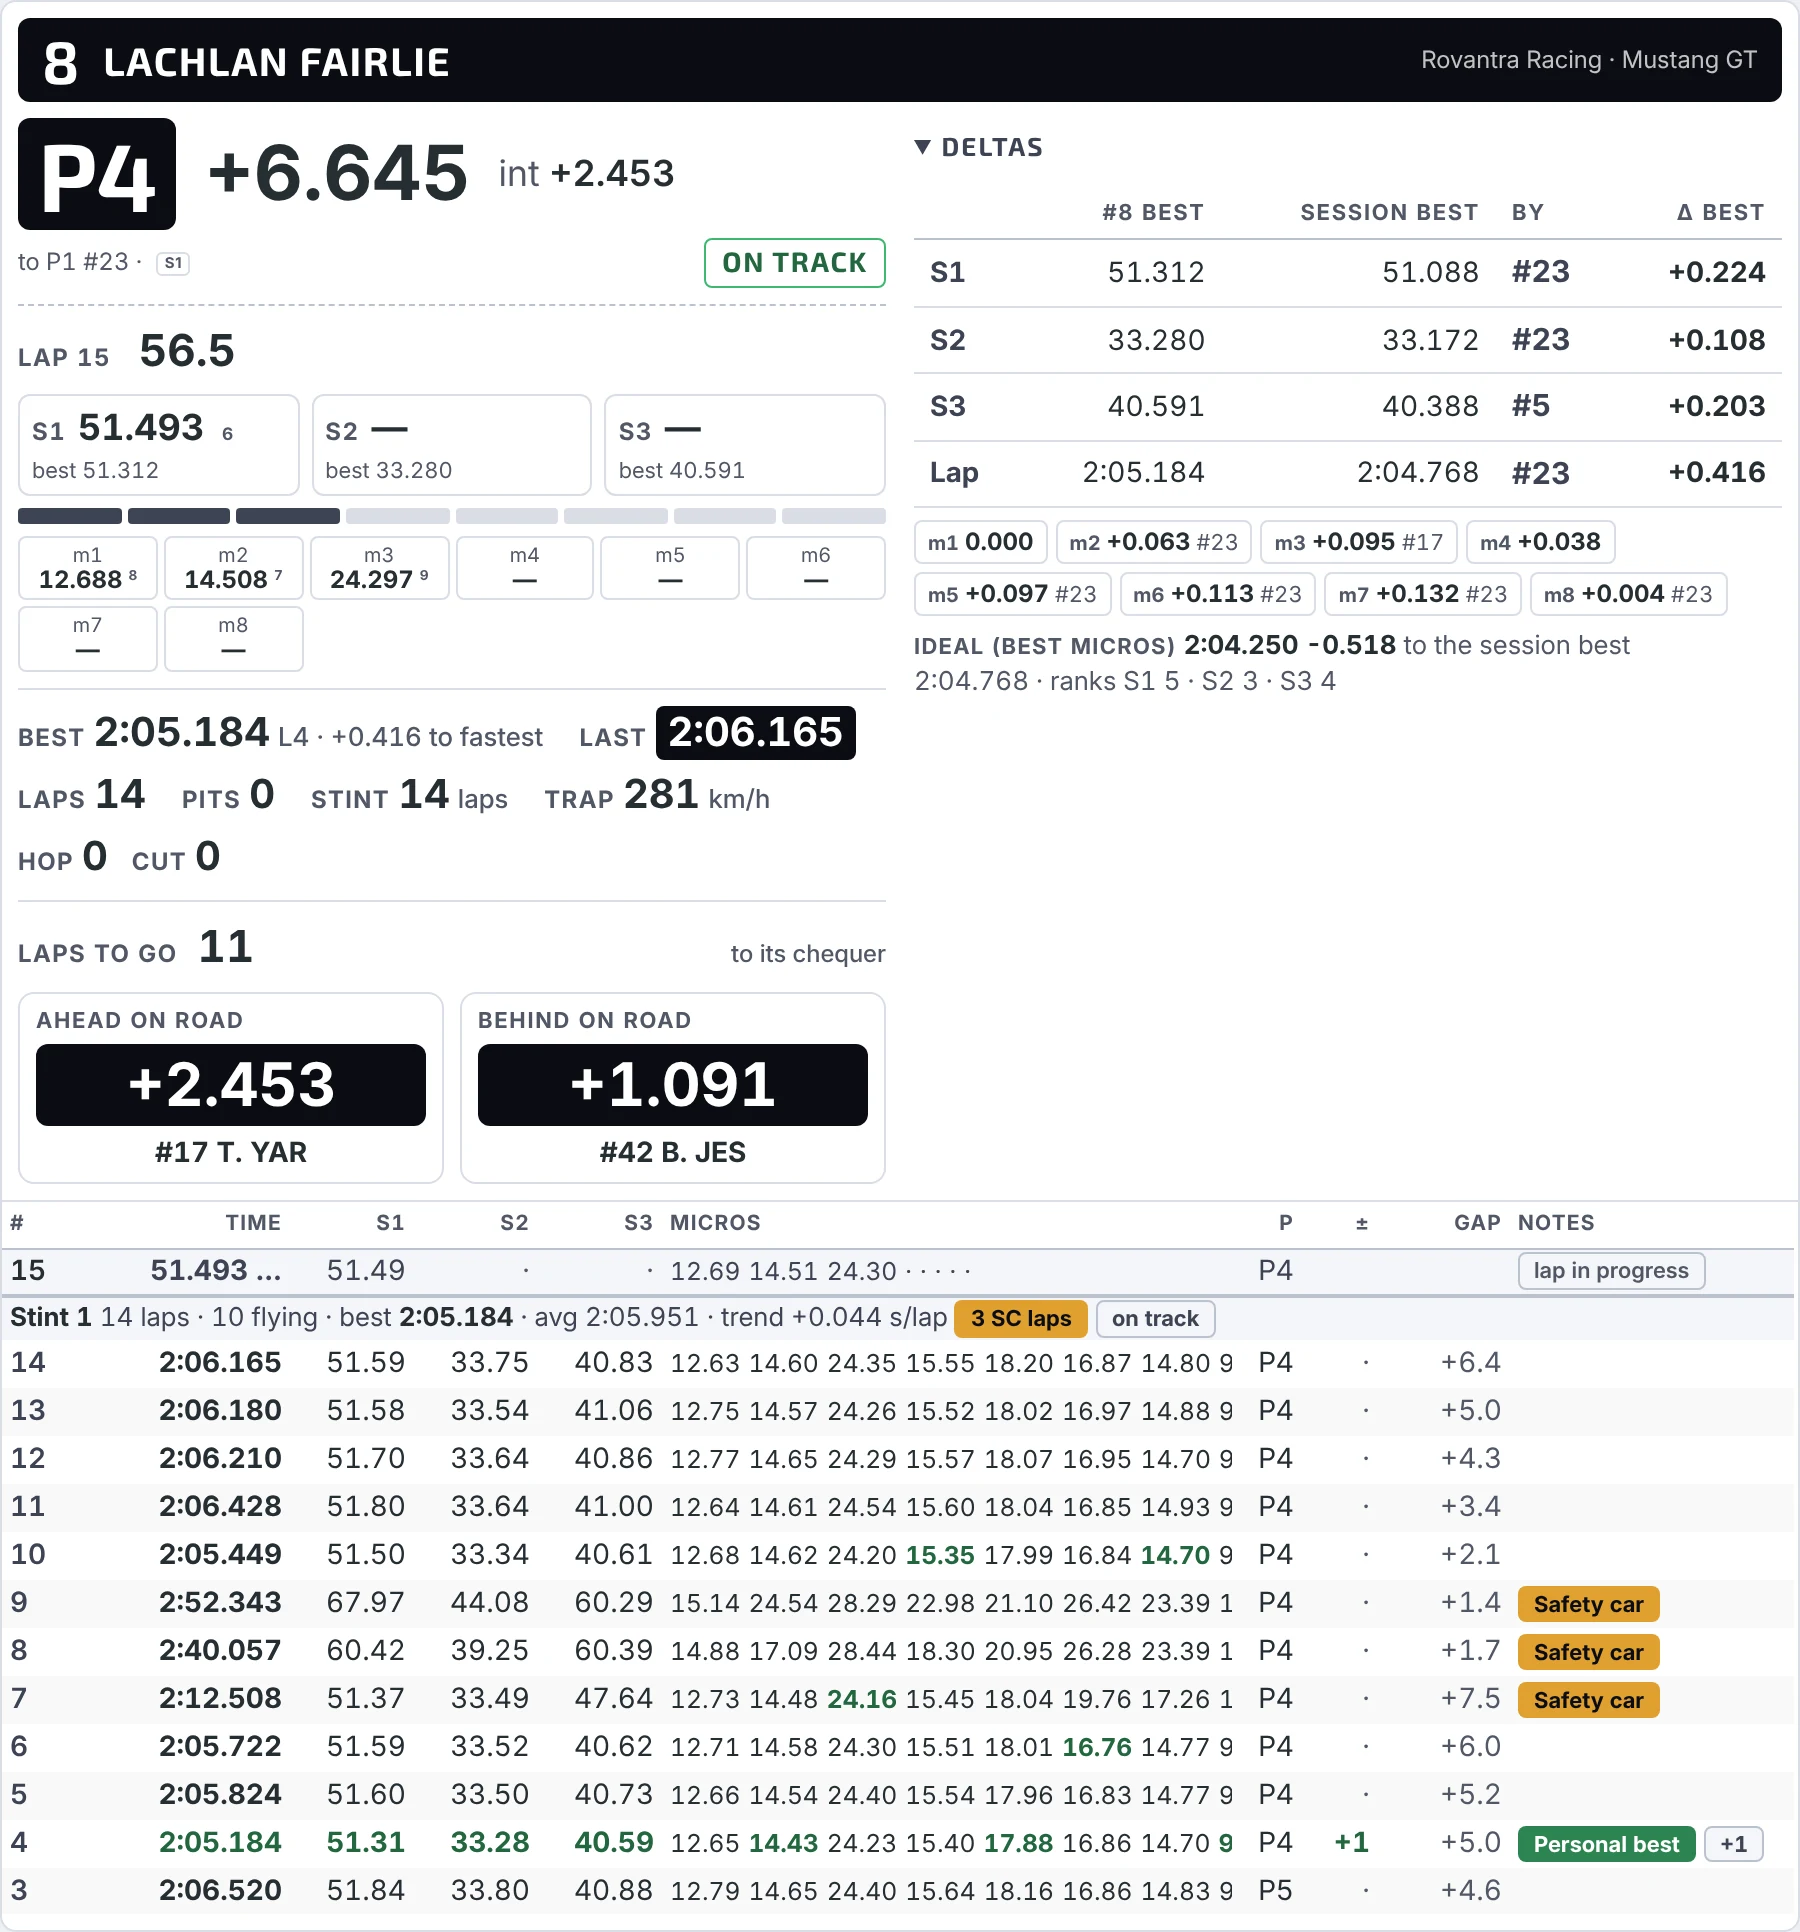
The focused car view in Rovantra Timing on one laptop, captured from the program replaying a race at Mount Panorama. Drivers, car numbers and teams are fictional.

Ready to raceEvery display set up out of the box
Every screenPhone, tablet, TV or computer
AutomaticReports exported after every session
IncludedRovantra Countdown hosted
01 · ONE LAPTOP

Intelligent displays and automated reporting.

One timing laptop does the work. Every display comes set up for the engineer, from My car and the timing tower to pit option, gap to target and the sector scoreboard, and the session report exports itself after every session.

  • Pick a focused car and every display follows it
  • Predicted values, such as a pit stop rejoin, are always marked
  • Reports export automatically after every session, in the format your team prefers
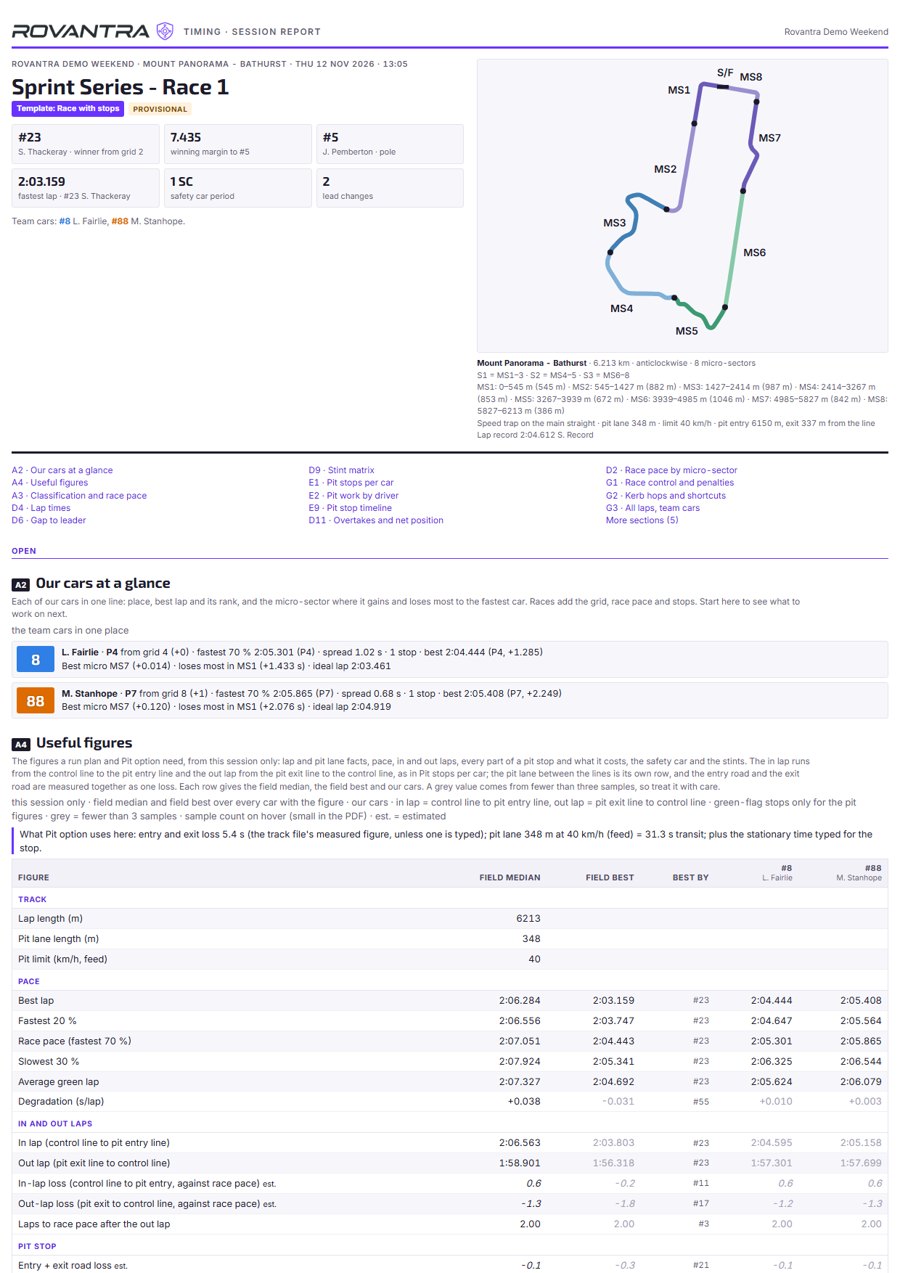
The first page of a Rovantra Timing session report for a sample race
02 · DATA STATION

More screens is where the views come alive.

Template pop-out displays fill a data station with multiple screens. Build a layout for each screen, send it to its own monitor, and every one runs from the same live feed on the timing laptop.

One timing laptop driving two fullscreen layouts in dark mode, Car Specific and Session Information, each on its own screen. Captured from Rovantra Timing running a sample race: drivers, teams and times are fictional.

03 · TEMPLATES

Set it up once. Use it every round.

Templates make setup easy and repeatable: save a layout and use it again at the next round, on the next laptop or for the next engineer. Each display is edited on its own, so changing one never upsets the rest.

  • Choose the columns, the focused car and the size of every display
  • Save layouts as templates, or as your own default
  • Pop any display out to its own screen on the data station

The display configurator: add displays to a layout, size them, and pop each one out to its own screen.

04 · EVERY DEVICE

Every phone, tablet, TV and computer in the team.

The timing laptop shares the timing over your team's local network. Anyone in the team opens it in a browser on their phone, tablet, TV or computer and picks the view they need.

  • My car, the tower, results, sectors, race control and the track map on every phone
  • Each phone keeps its own car and its own screen
  • Your timing data stays on your laptops and your own network
05 · SECTORS AND RACE CONTROL

Find the time, and never miss a call.

Sector scoreboards show who is fastest where, and the ideal lap shows what your car has in it. Race control messages, flags and penalties are attached to the cars they affect.

  • Sector, micro-sector and speed trap leaderboards for the session
  • Ideal laps for every car
  • Flags, safety cars and penalties in one feed, newest first
06 · REPORTS

Reports that export themselves, the way you like them.

Reports are configurable. After every session, Rovantra Timing exports the report automatically in the format your team prefers, from sector scoreboards and stint matrices to pit lane times and driver KPI rankings.

  • Templated to the type of session and race
  • Choose the pages your team wants
  • Social-ready pages for your sponsors and fans
Session report · Sprint Series Race 1Scroll and click to explore

An interactive Rovantra Timing session report, written automatically after a sample race. Drivers, teams and times are fictional.

07 · AT THE TRACK

Runs at the track, on your own network.

Each timing laptop reads your team's own Natsoft feed, and every phone, tablet and screen on your team's local network follows along. Your timing data stays on your laptops and your own network.

In a browser

Phones, tablets, TVs and computers open the timing in a browser, each with its own view.

Your own network

Team devices follow the timing laptop over your local network, in the garage or at the data station.

Direct to Natsoft

Plug straight into the Natsoft stream at the track when you need to.

Replay any session

Play back recorded sessions to review the race again.

Every display

26 displays. Put any of them on any screen.

Each display is edited on its own, and any of them can go into a layout on the laptop, a TV, a tablet or a phone. Scroll through to see what each one shows.

  • Results display
    Live timing

    Results

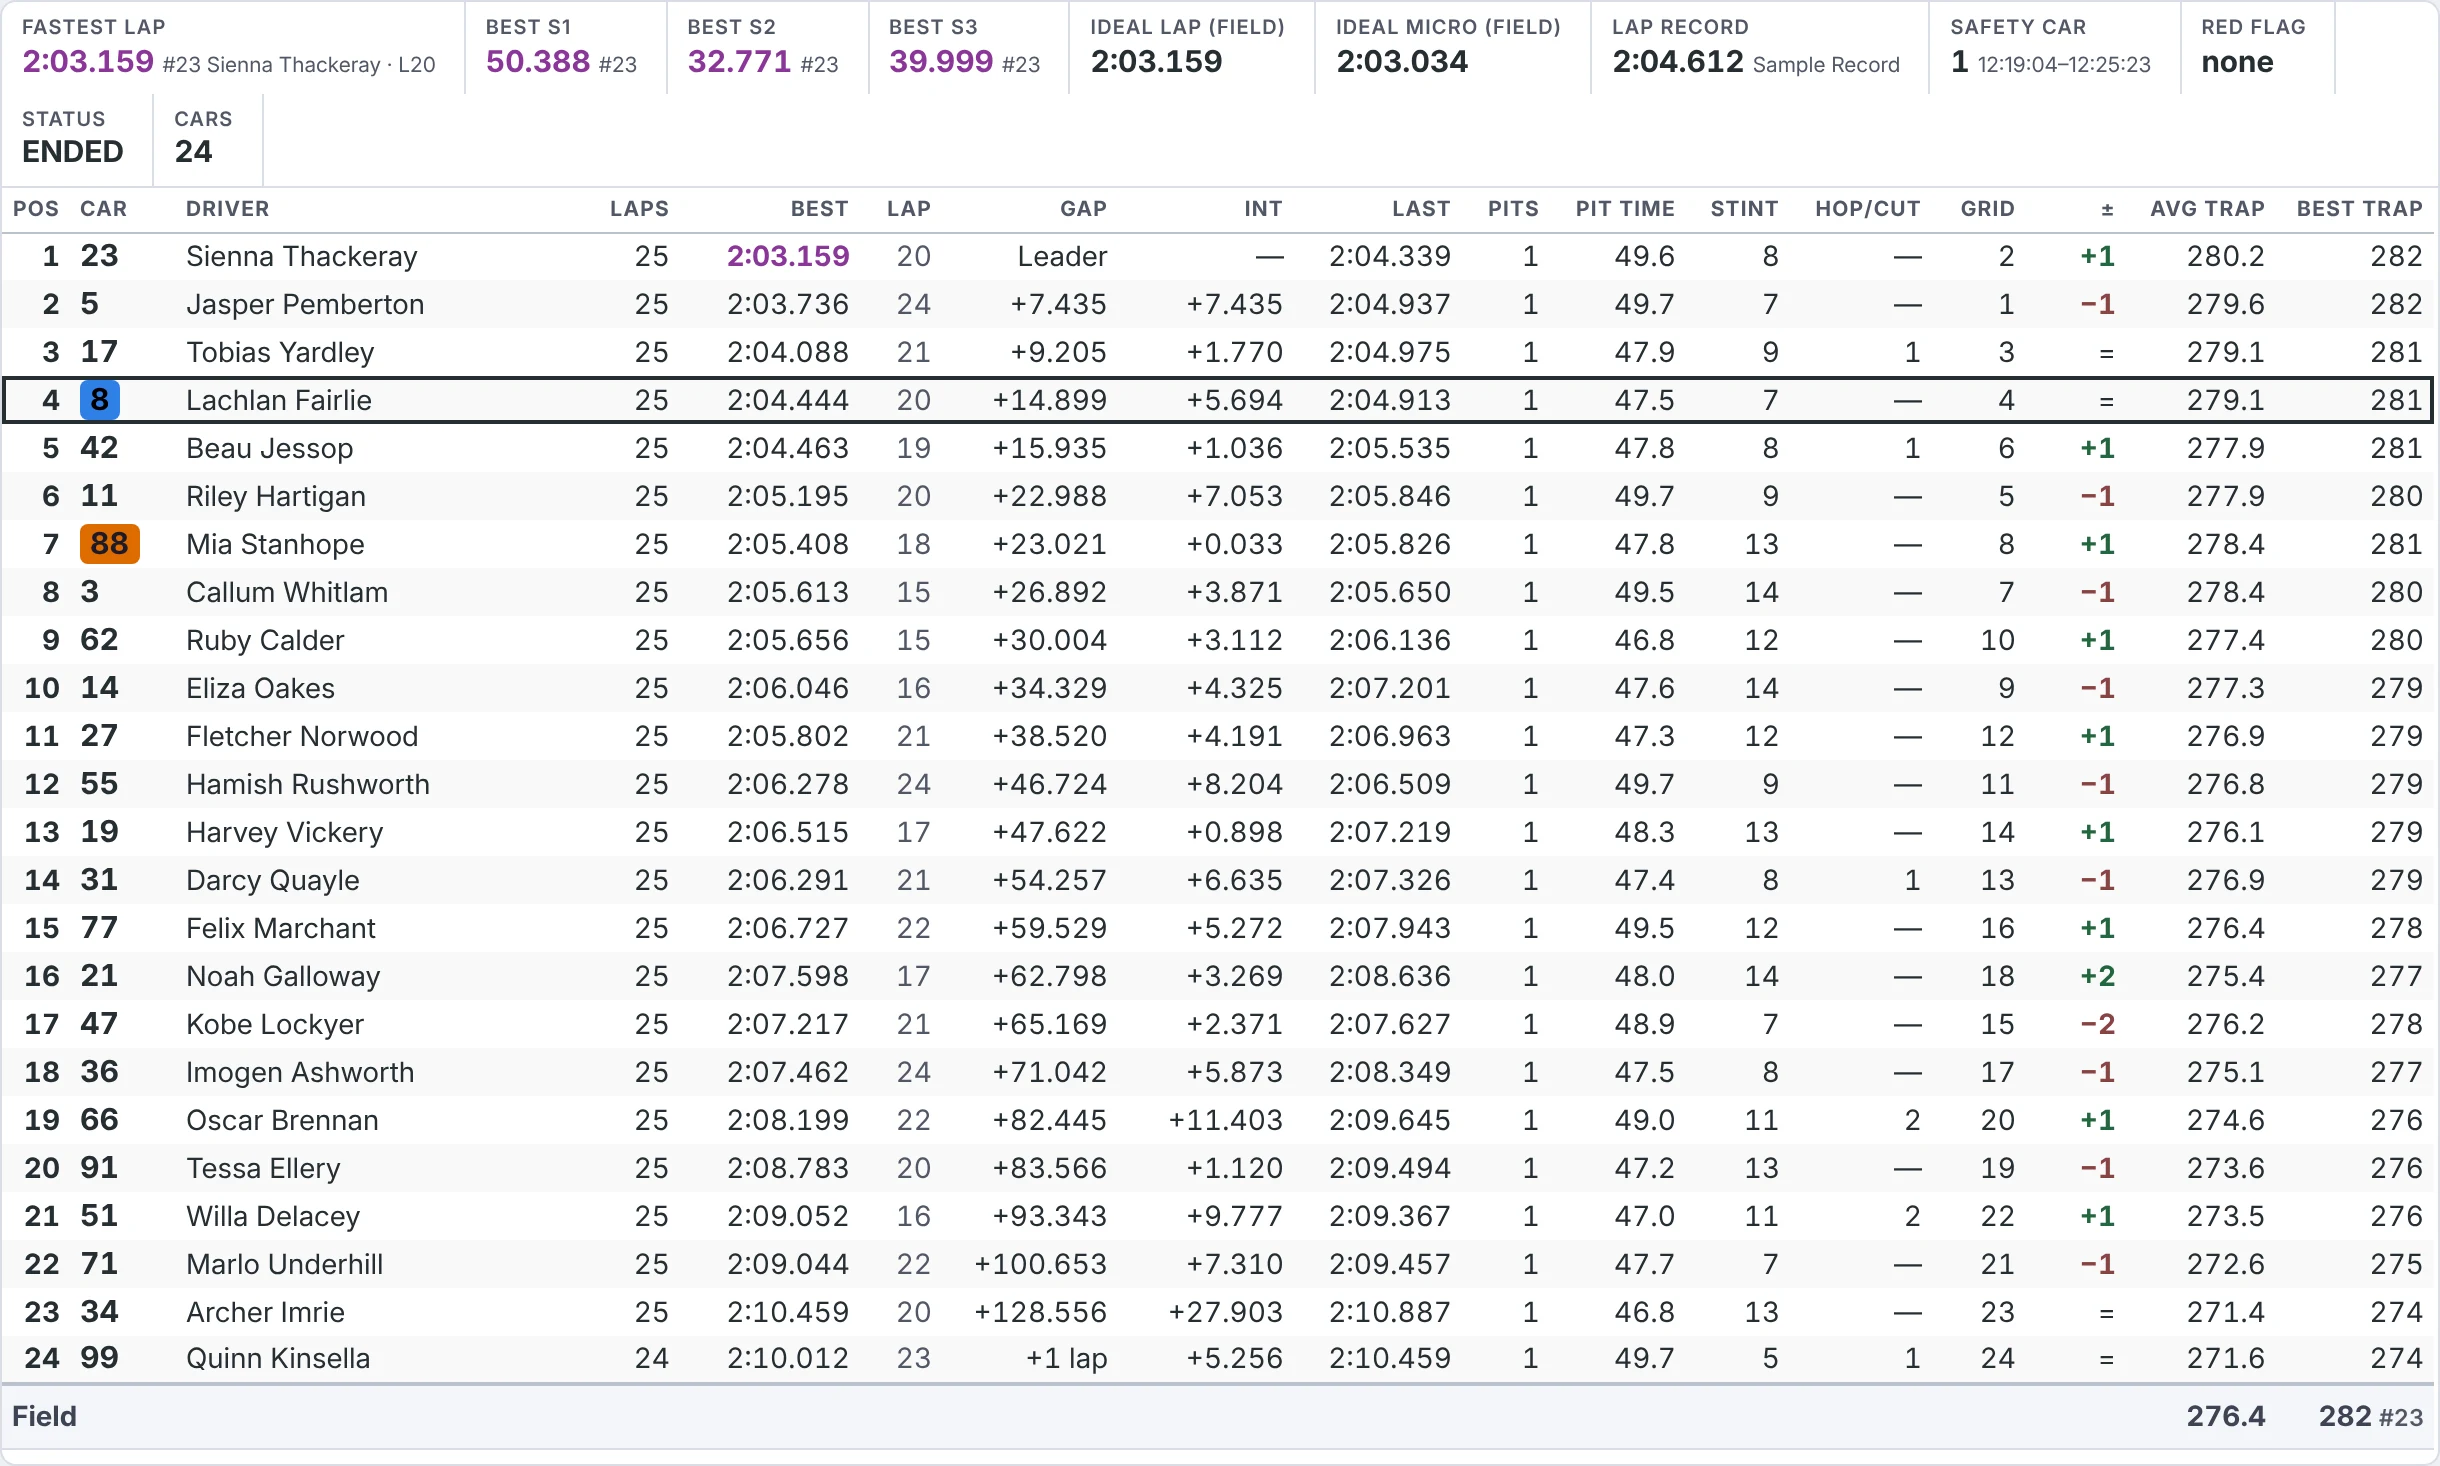
    The classification, live during the session or final.

    Fastest lap, best sectors, ideal lap, safety cars and penalties, with class positions.

  • Track map display
    Track and race control

    Track map

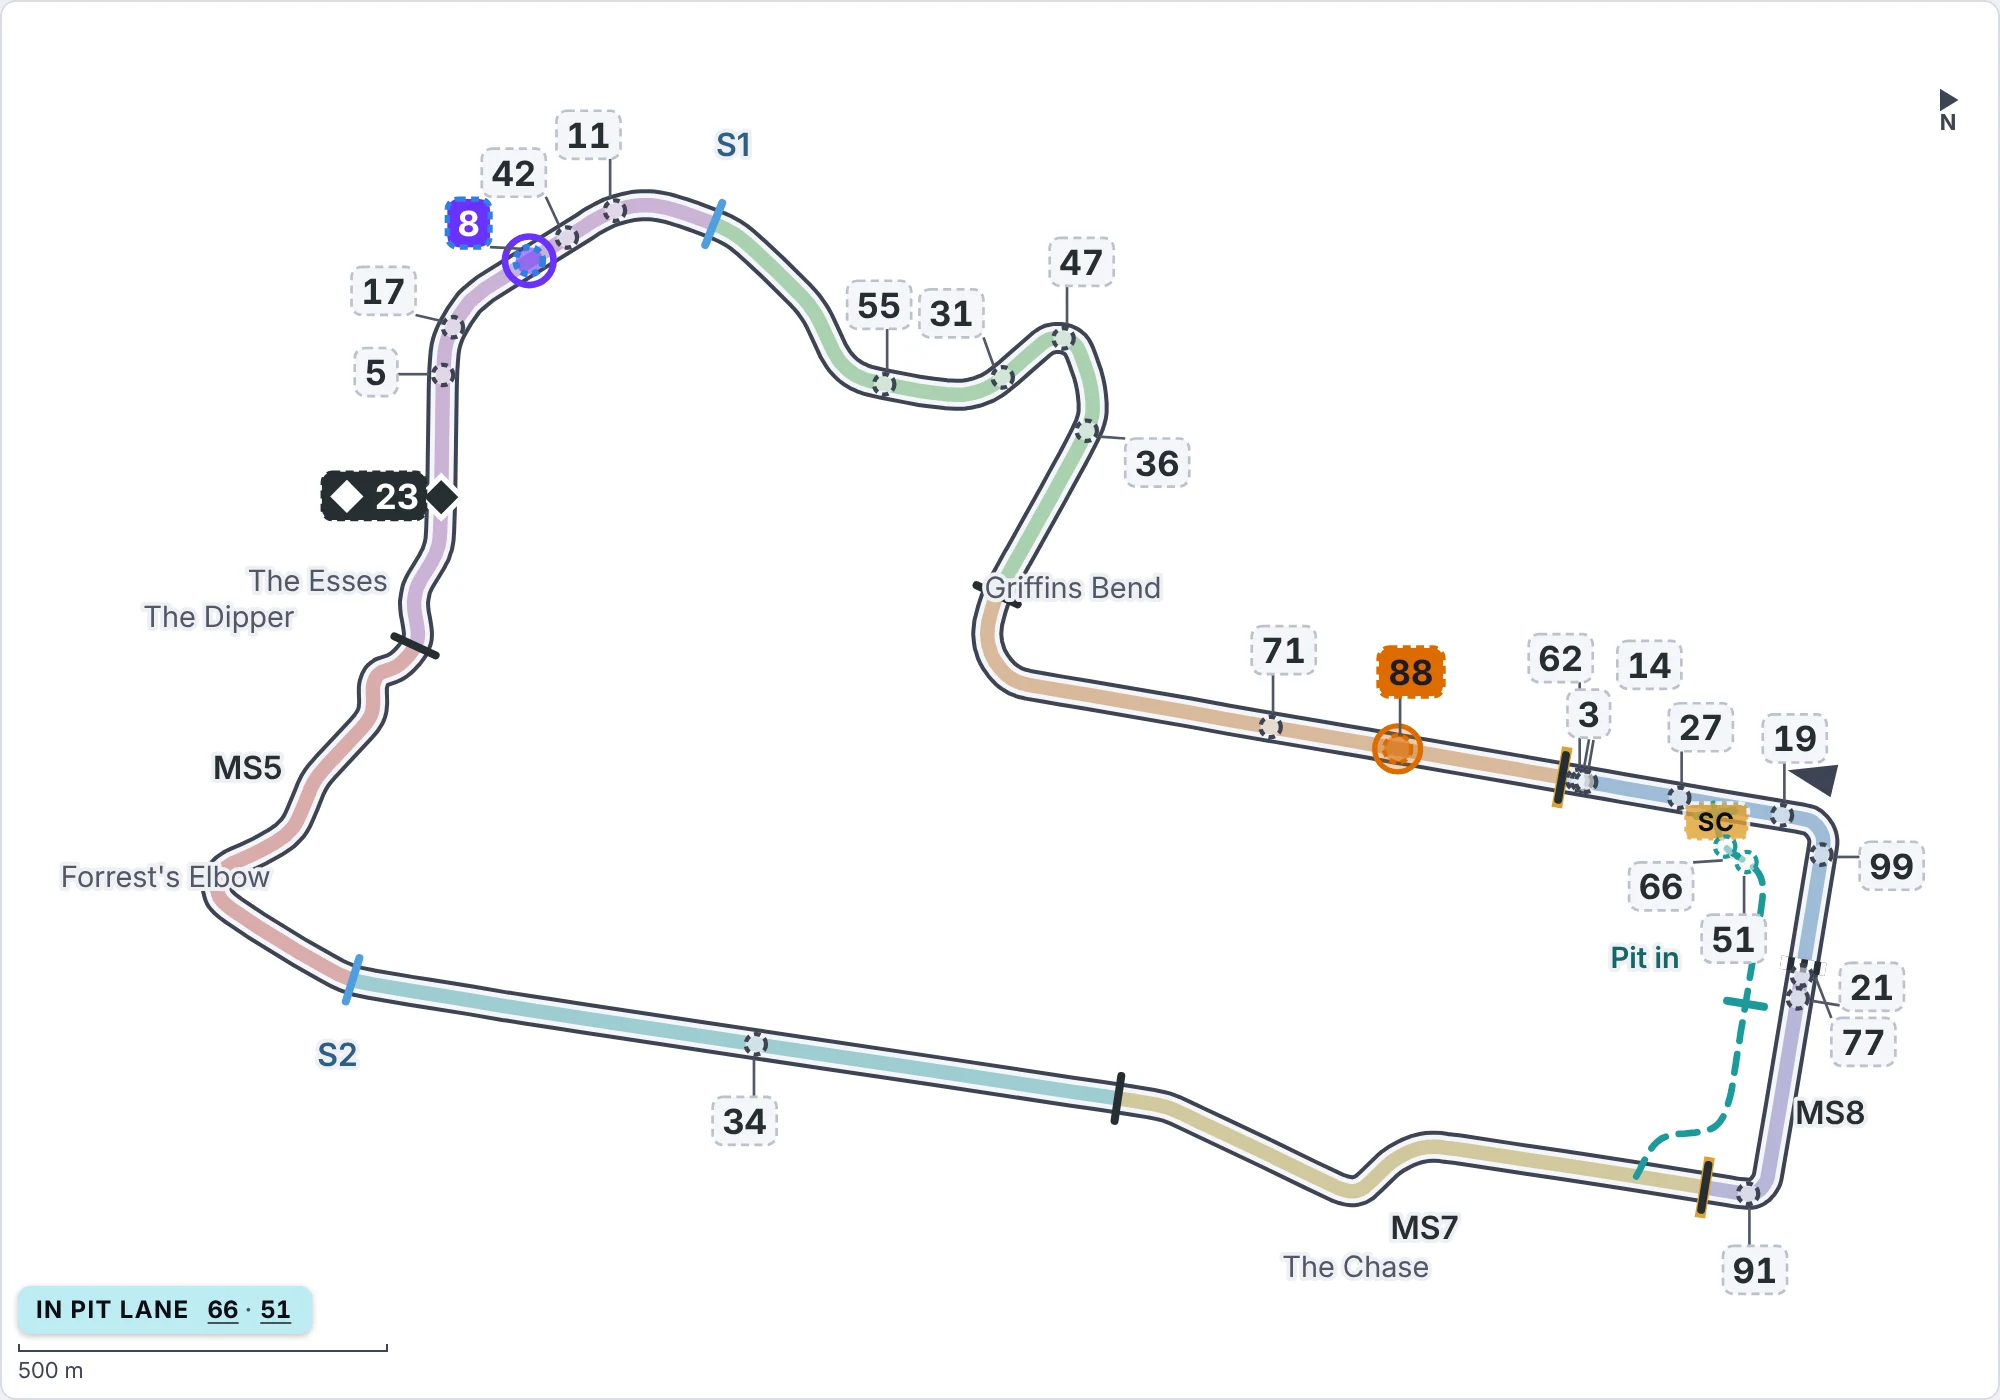
    Every car on the circuit, the pit lane and the safety car.

    Every Australian circuit is built in, with the timing loops, sectors and pit lane drawn. It becomes a circle map when the slot is small.

  • Sector tower display
    Live timing

    Sector tower

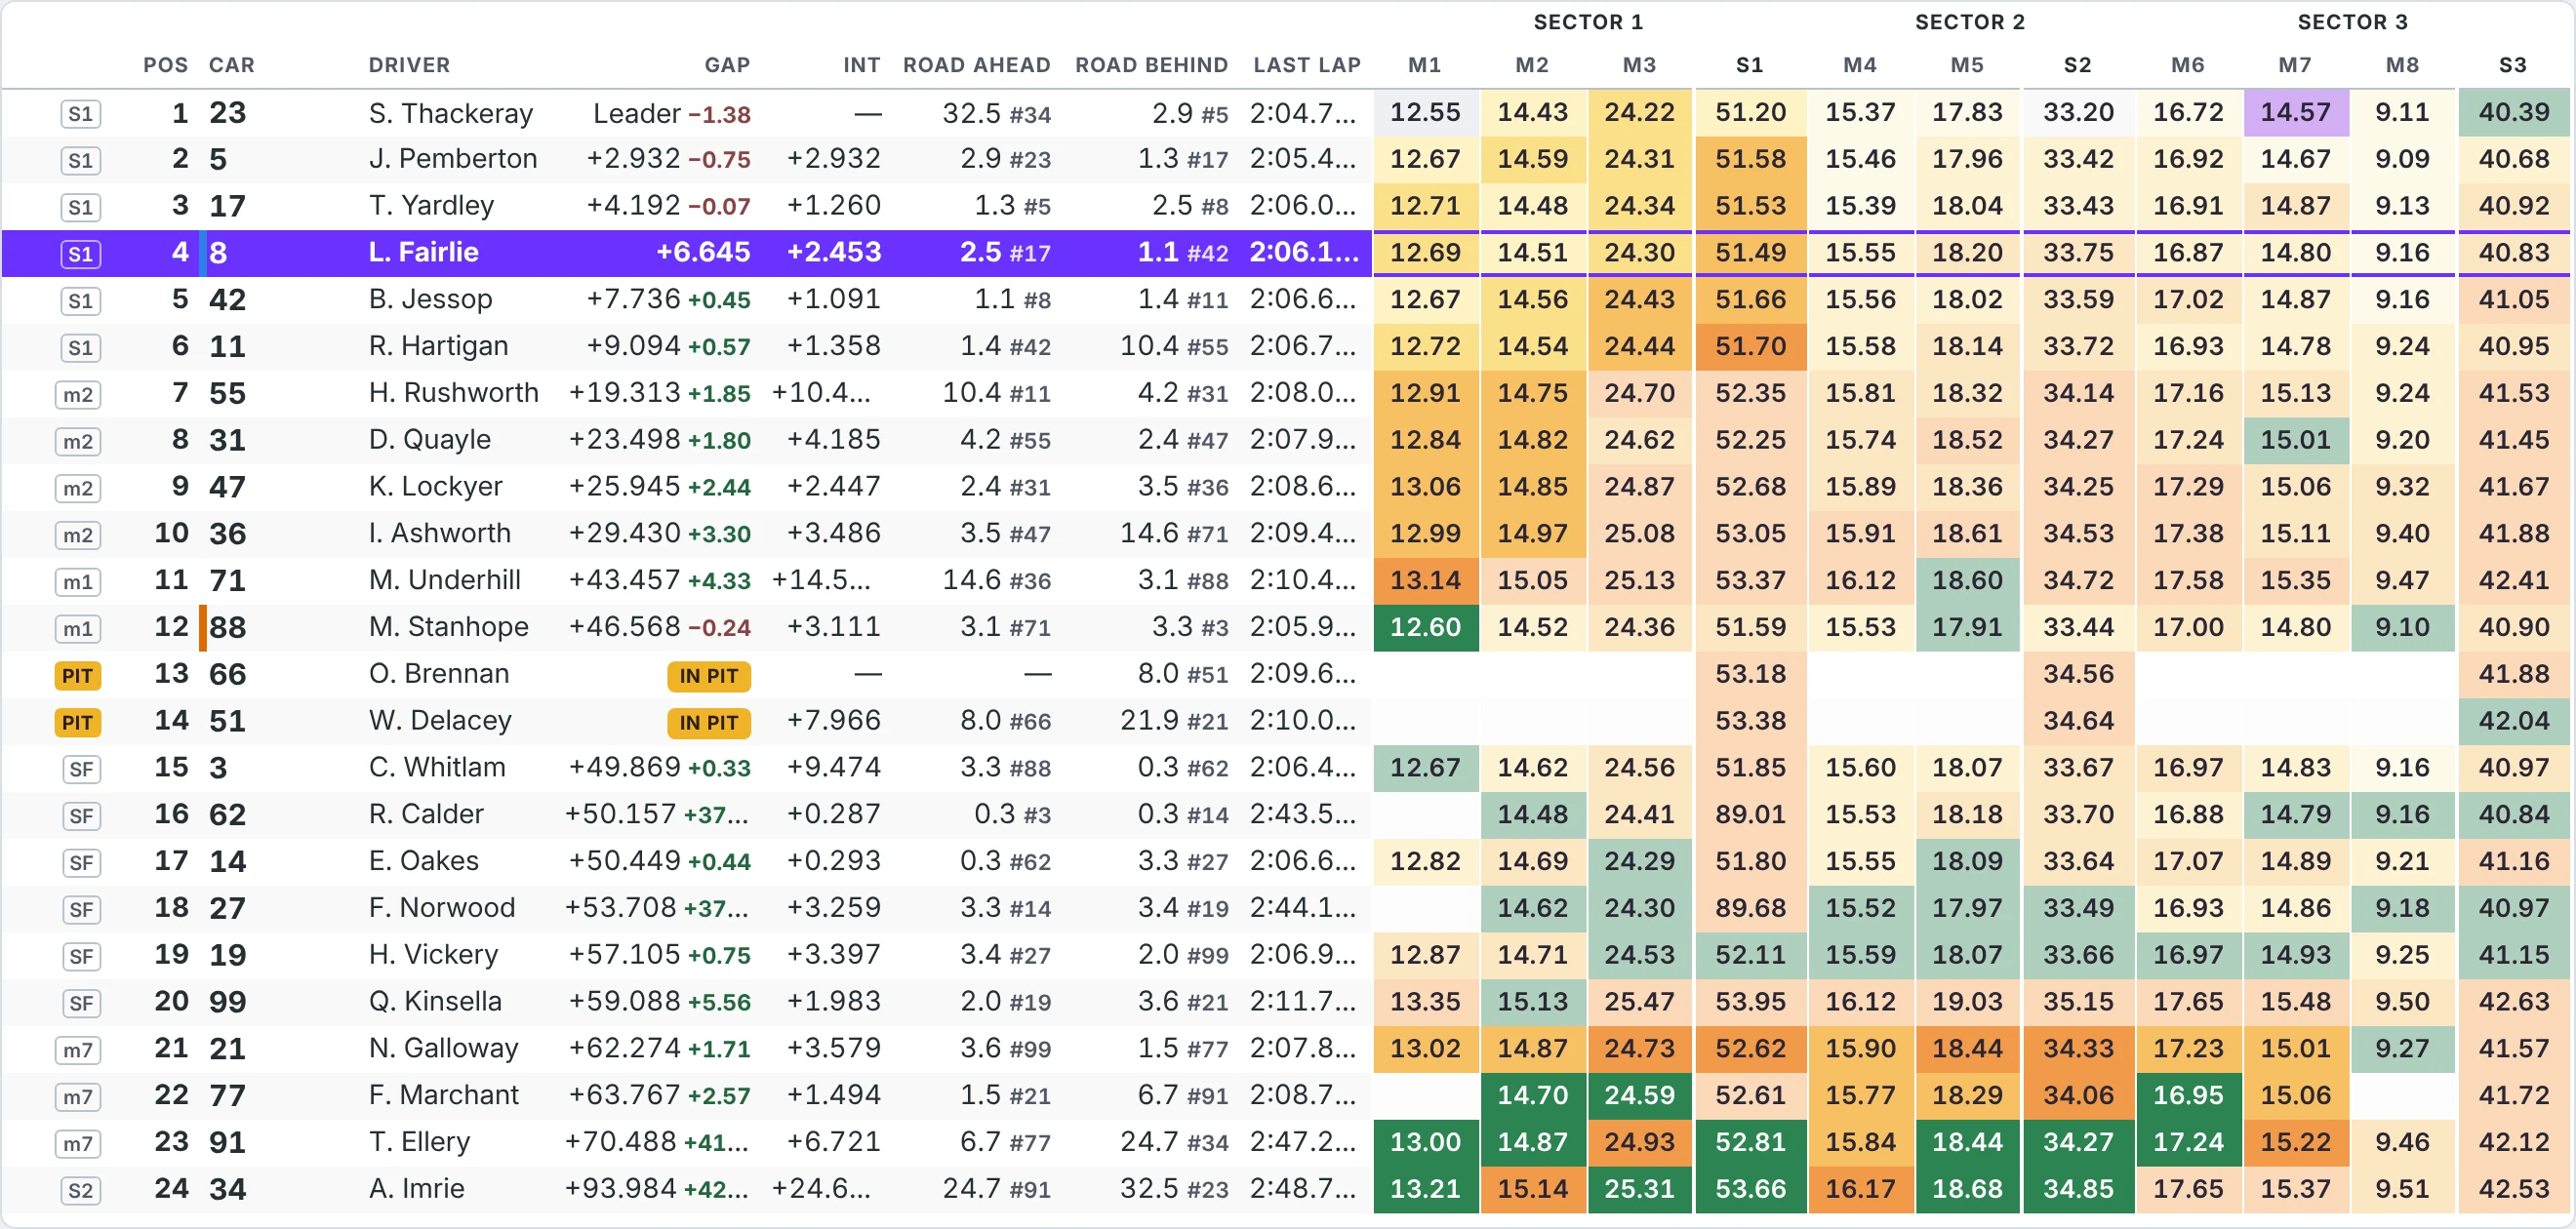
    The tower with a live sector and micro-sector heatmap.

    See at a glance where each car is gaining or losing time, in position or on-track order.

  • Timing tower display
    Live timing

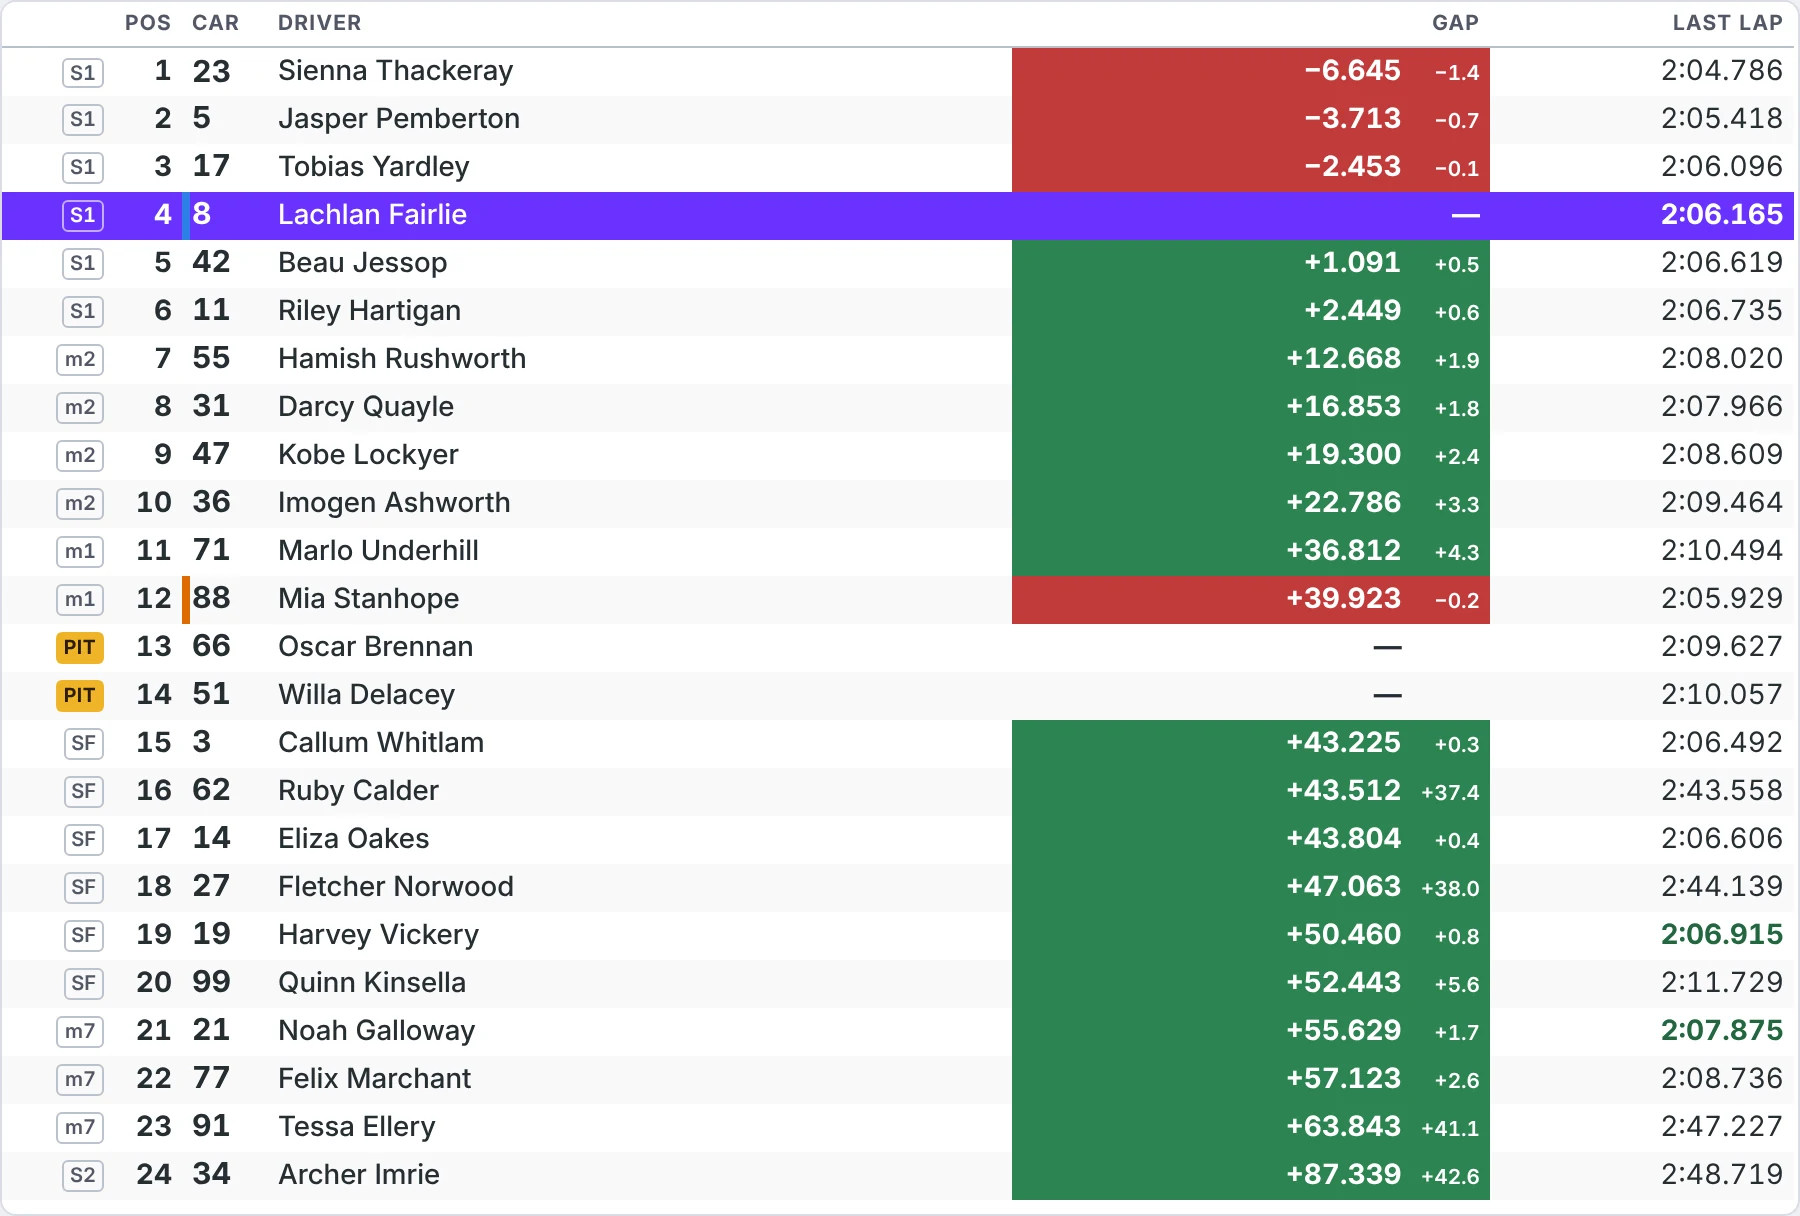
    Timing tower

    Every car in order, with gaps, intervals, last and best laps.

    The screen everyone looks at first. It shrinks to position, car and gap when the slot is small, and highlights the team’s cars.

  • Lap chart display
    Charts and analysis

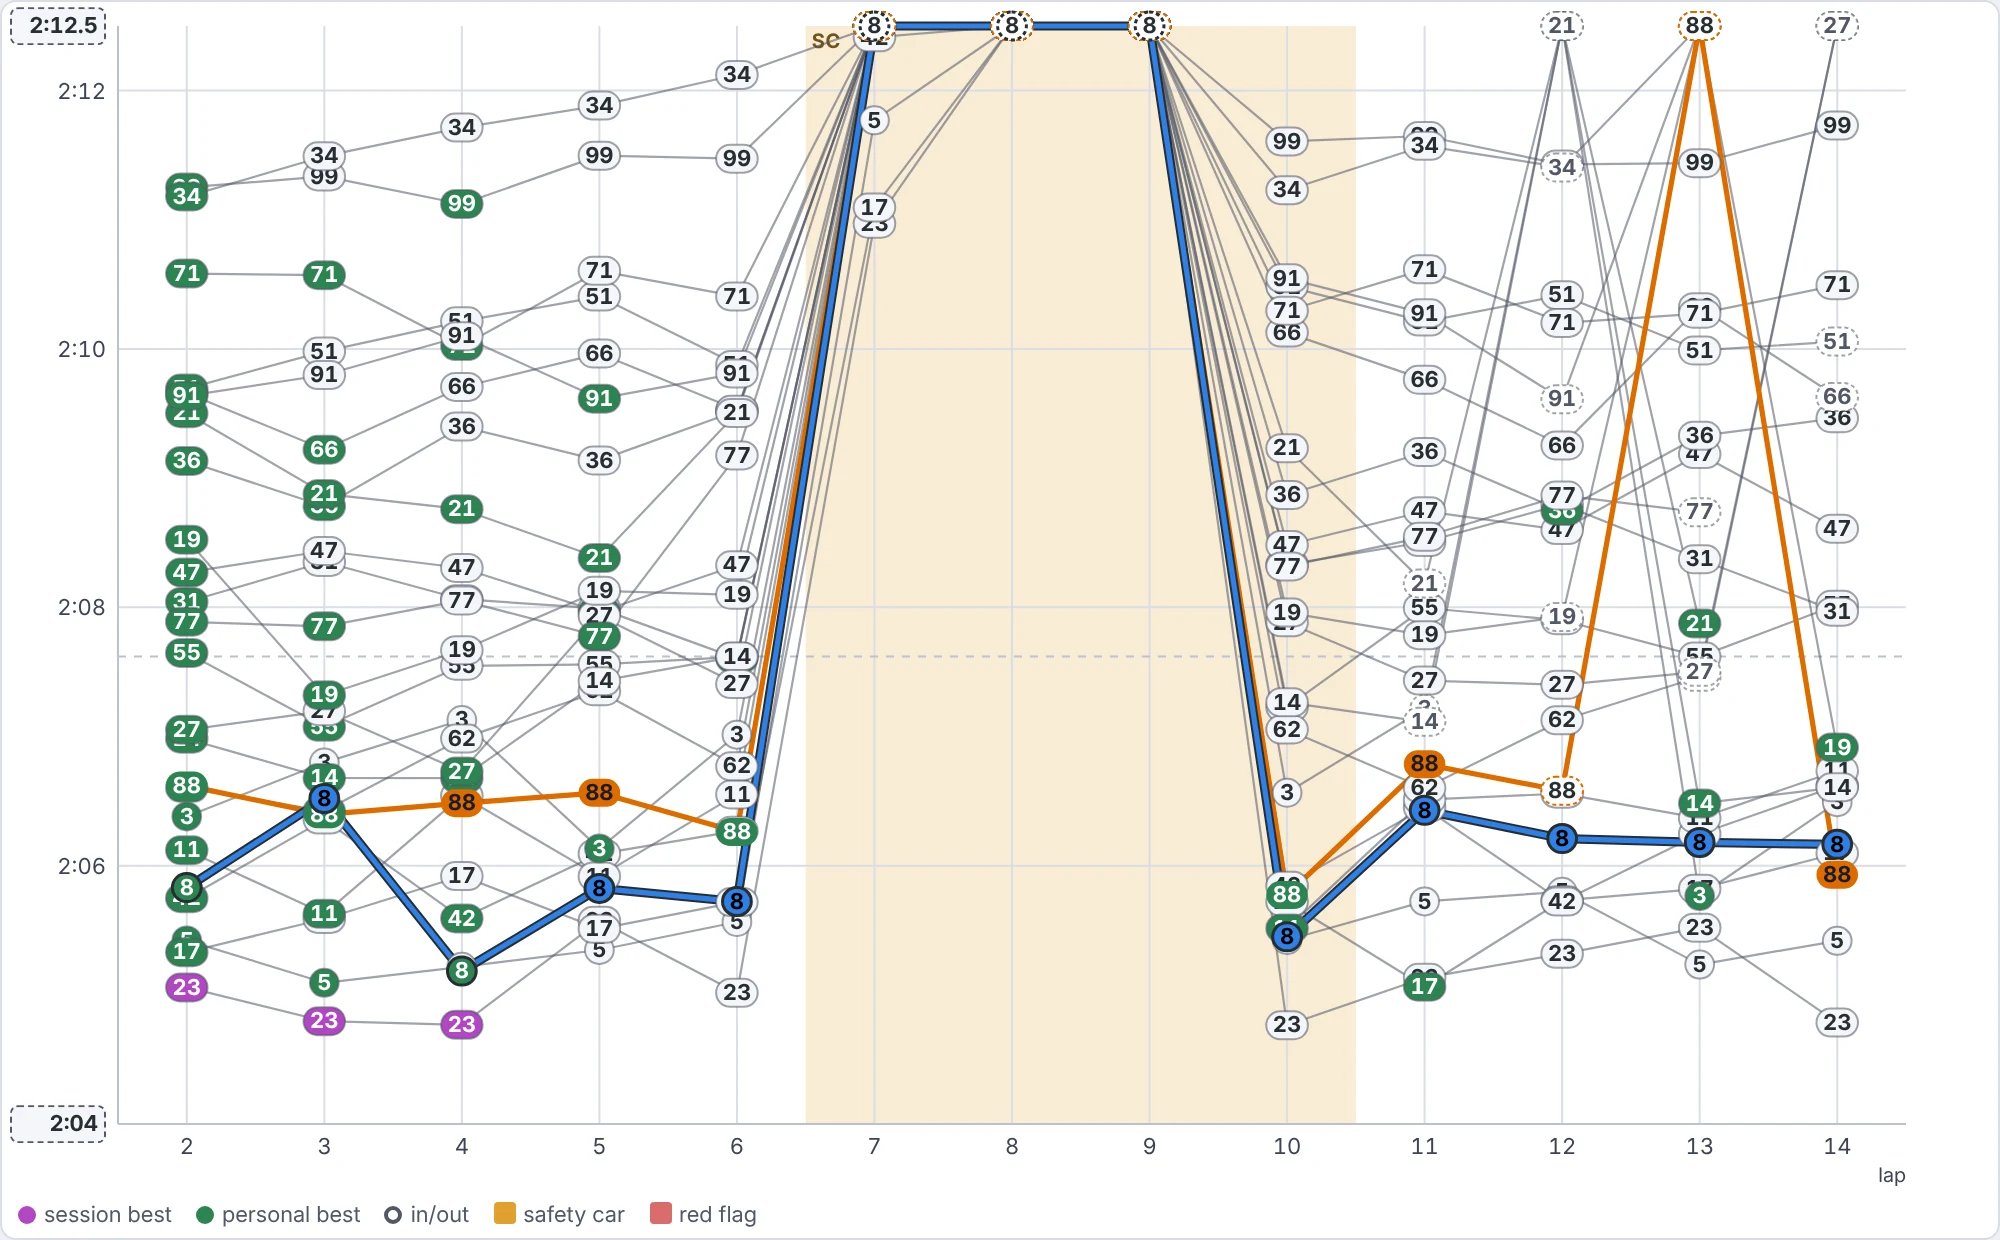
    Lap chart

    Lap times for the team’s cars and any cars you pick, by lap or time of day.

    Compare pace across the field lap by lap, with safety car laps shaded.

  • My car display
    Live timing

    My car

    Everything about one car: position, the lap in progress, its figures, ahead and behind on the road, deltas and its laps.

    The engineer’s view of the driver’s session. Set it up on a single screen, or scroll down through it on a phone.

  • Sector scoreboard display
    Charts and analysis

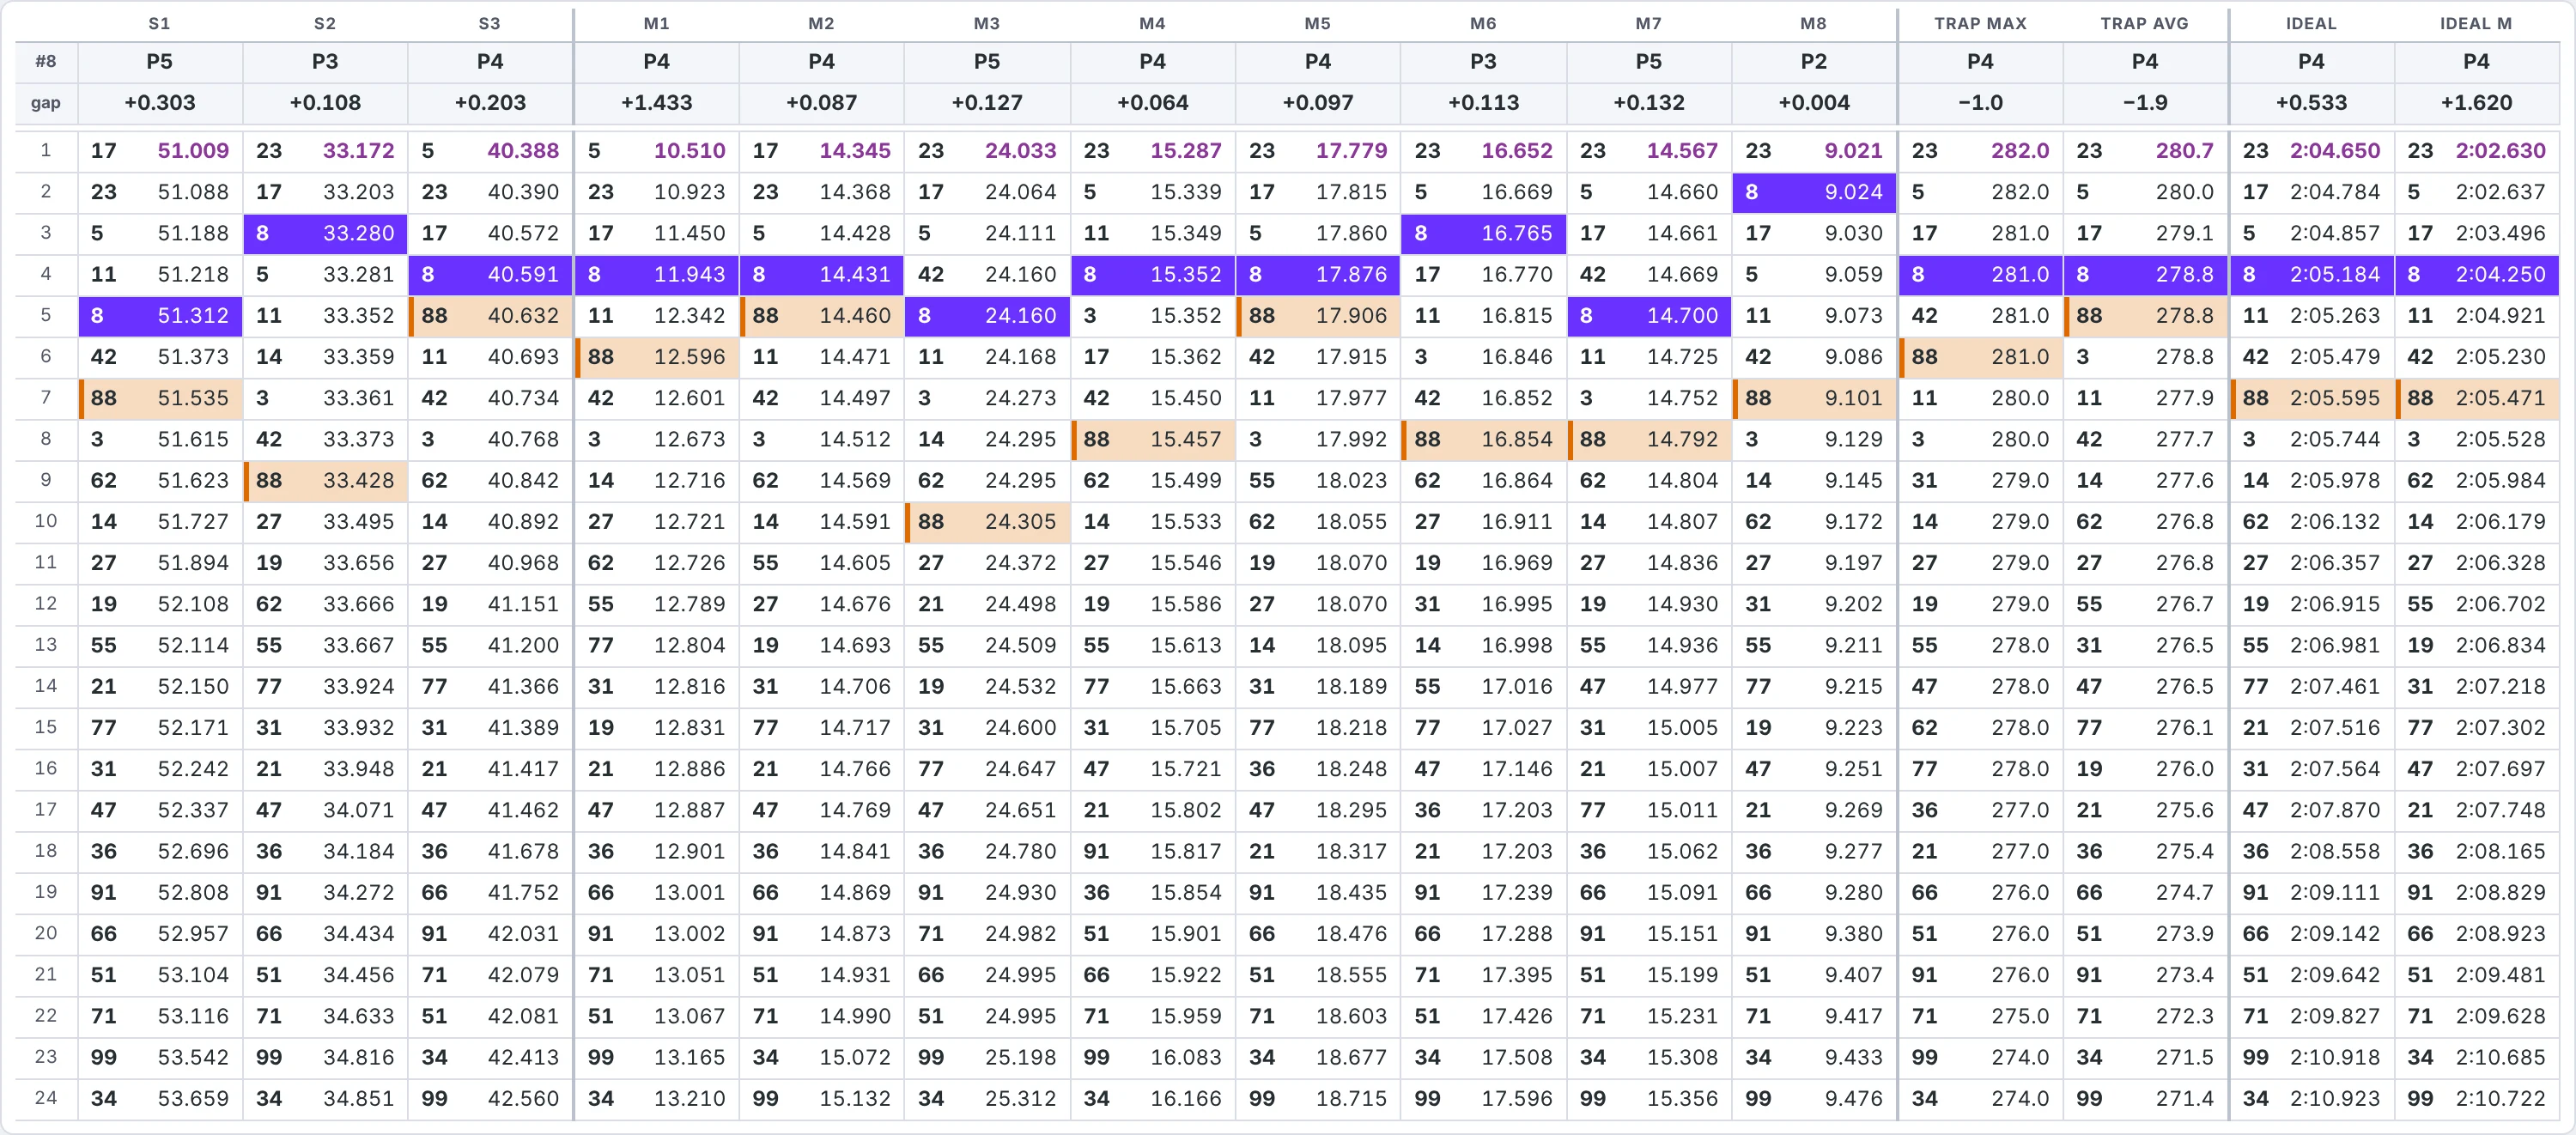
    Sector scoreboard

    Every sector, micro sector, speed trap and ideal lap, ranked.

    Where the time is, for the whole field, as a compact table or boards.

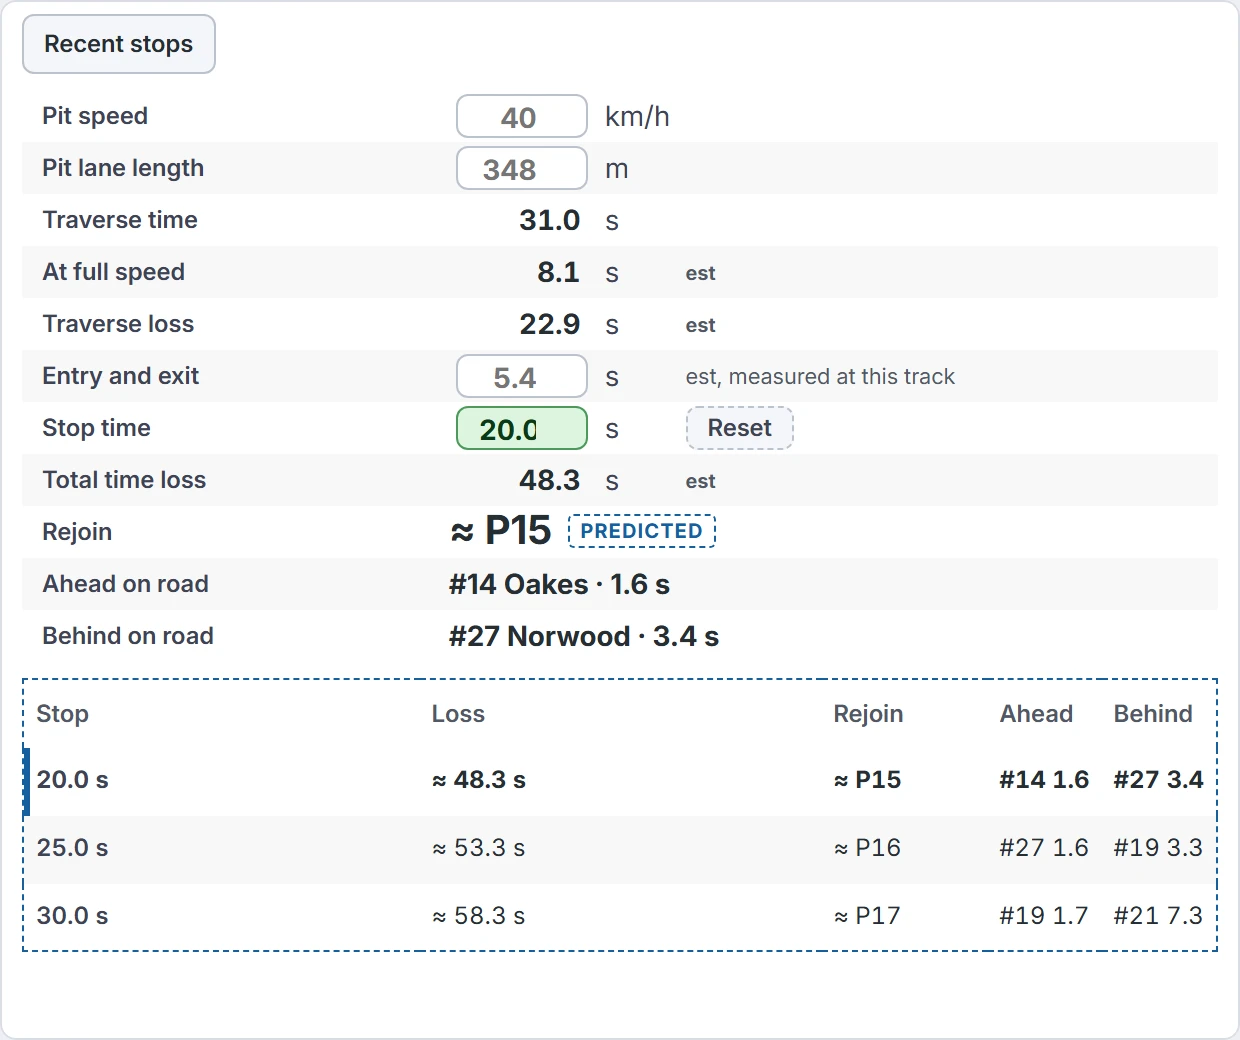
  • Pit option display
    Strategy callsPredicted

    Pit option

    What a stop costs and where the car would come out.

    Set up in the focused car tab. Enter the stop time and every display on the layout shows the result, marked predicted.

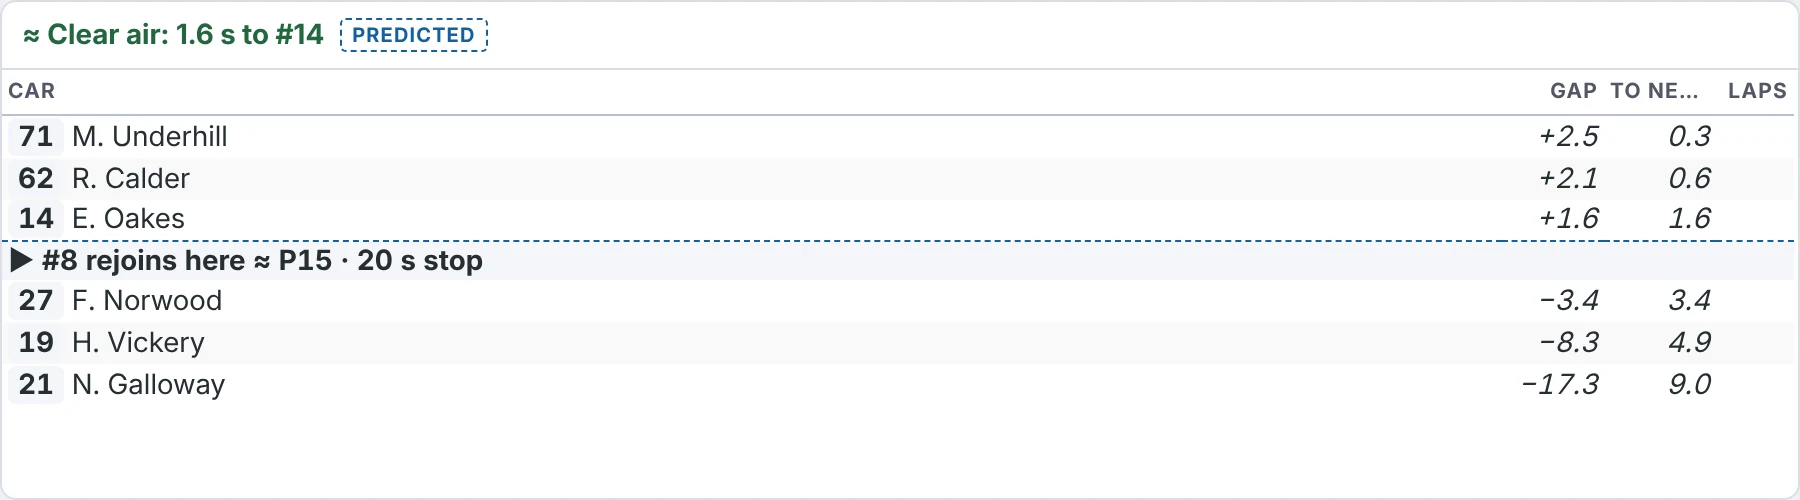
  • Traffic on rejoin display
    Strategy callsPredictedNew

    Traffic on rejoin

    The cars yours would rejoin among if it pitted now, with the gaps.

    Know before the call whether the car comes out in a train or in clear air. Marked predicted.

  • Gap to target display
    Charts and analysis

    Gap to target

    Every car’s gap to the leader, or a car you pick, lap by lap.

    See who is closing and who is dropping back.

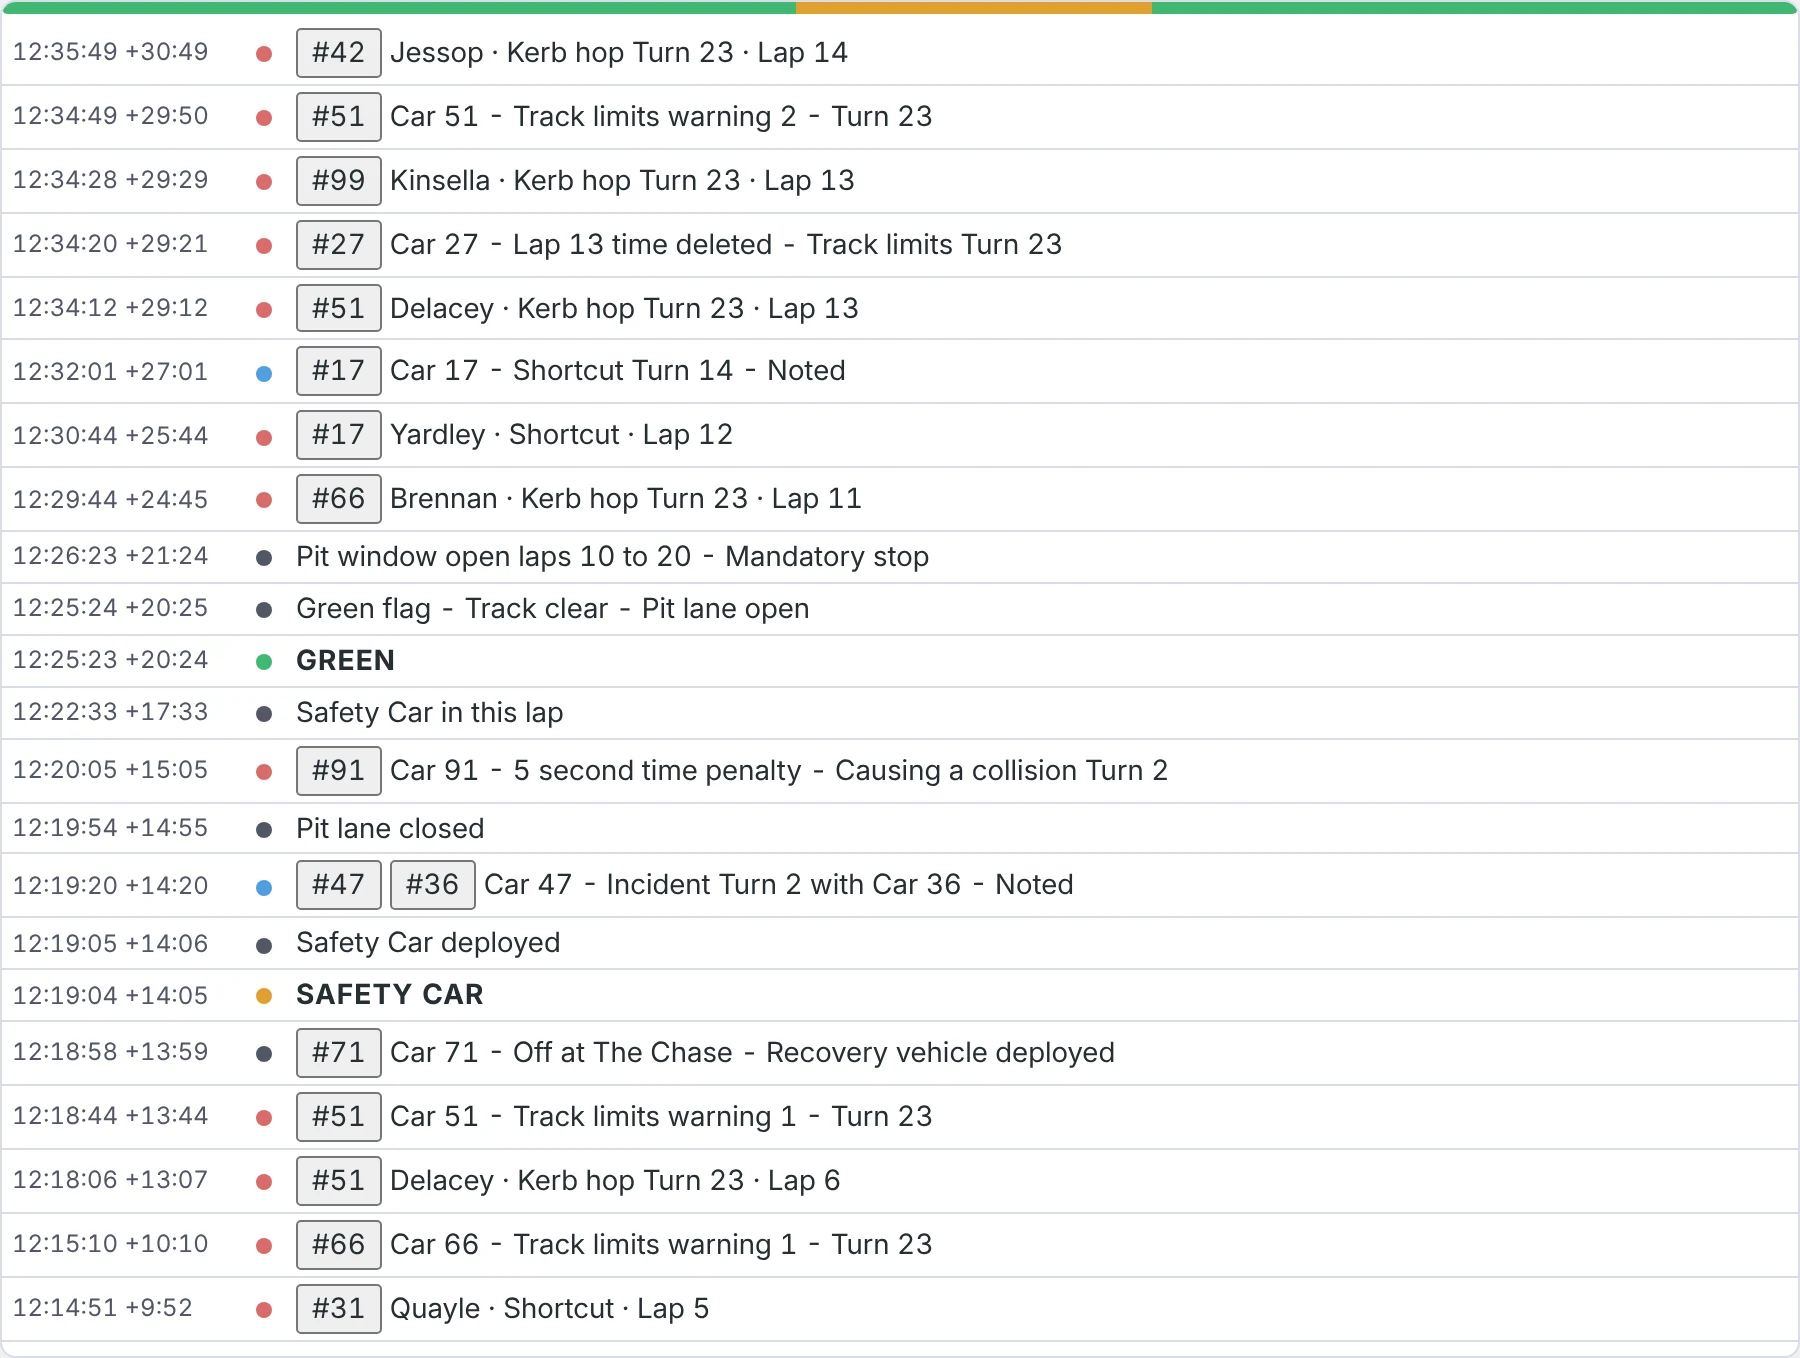
  • Race control display
    Track and race control

    Race control

    The flag strip, then race control messages, newest first.

    Flags, incidents and penalties, one line each, with the cars involved highlighted.

  • Live points display
    Race weekend

    Live points

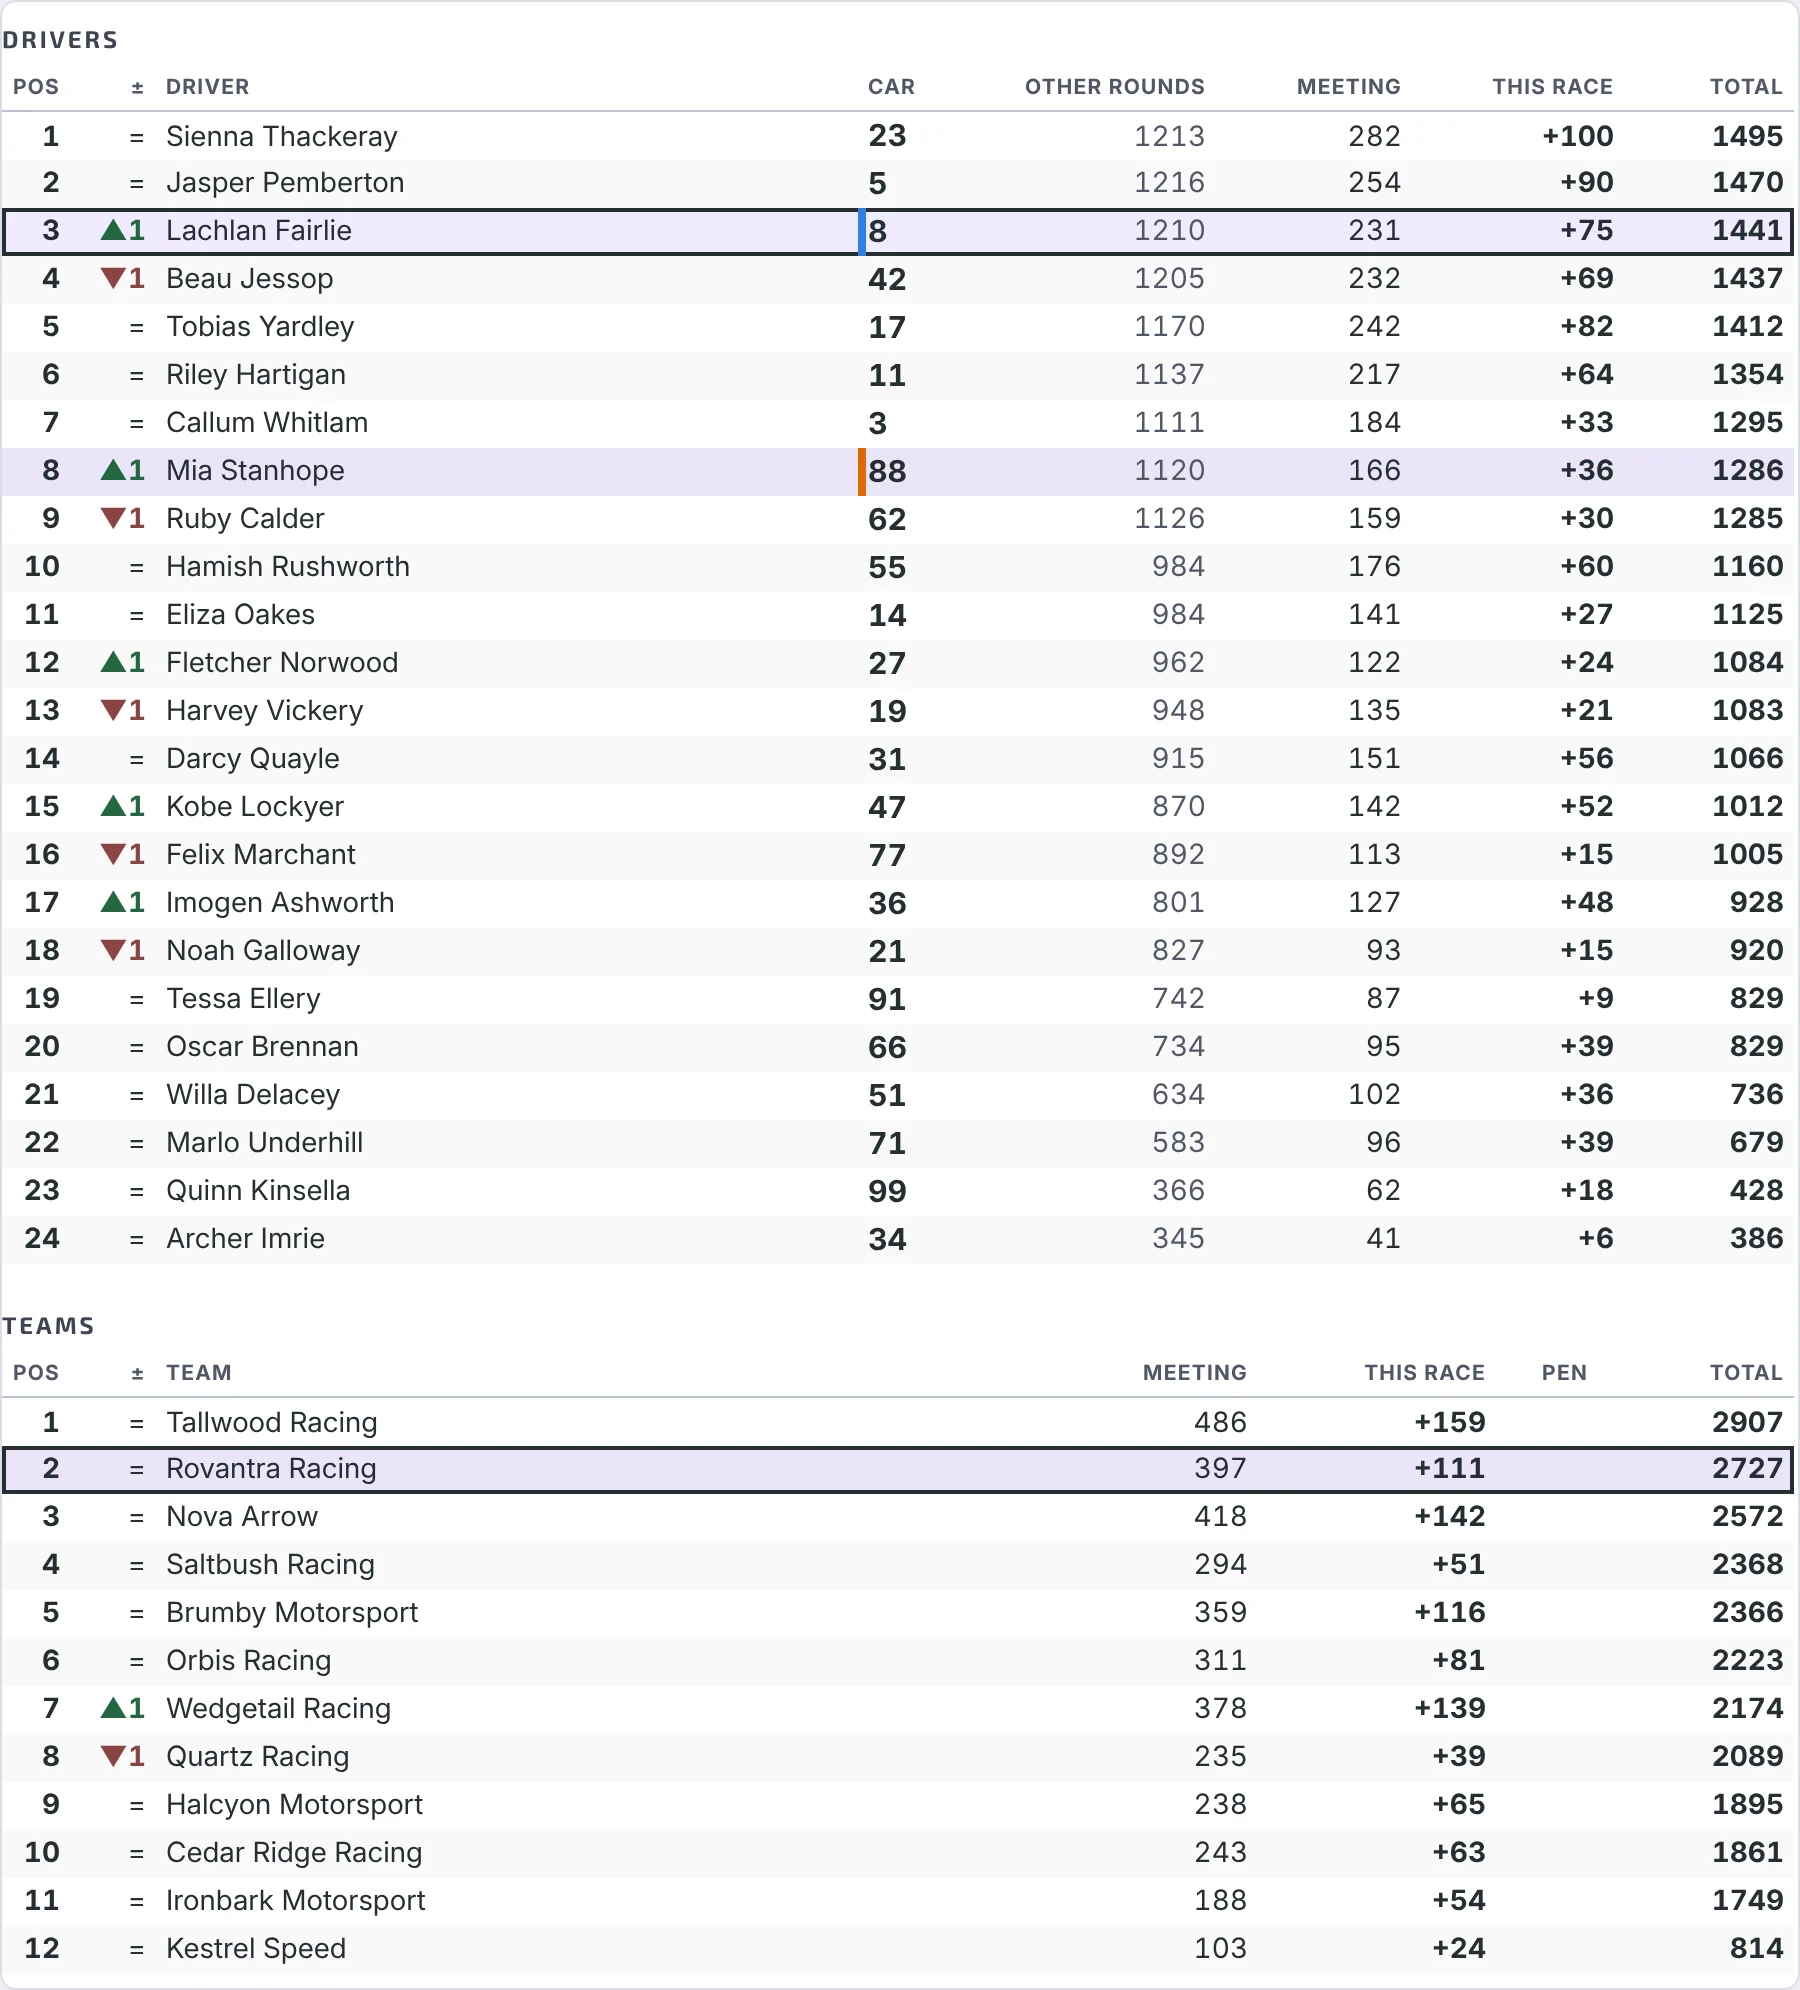
    Championship standings, live during the race.

    The championship as it would stand if the race finished now, with movement up and down the table.

  • Car laps display
    Live timing

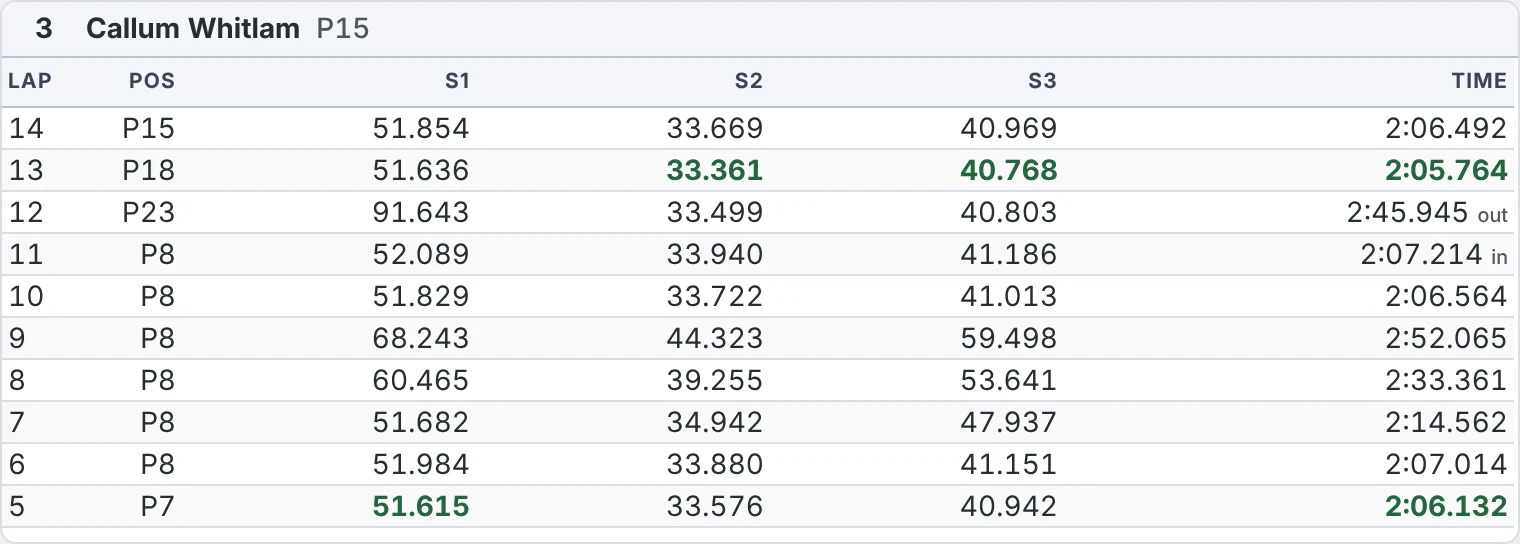
    Car laps

    One car’s laps, newest first, with in and out laps and safety car laps marked.

    Watch a rival lap by lap. Add as many as you like to a layout, one per car.

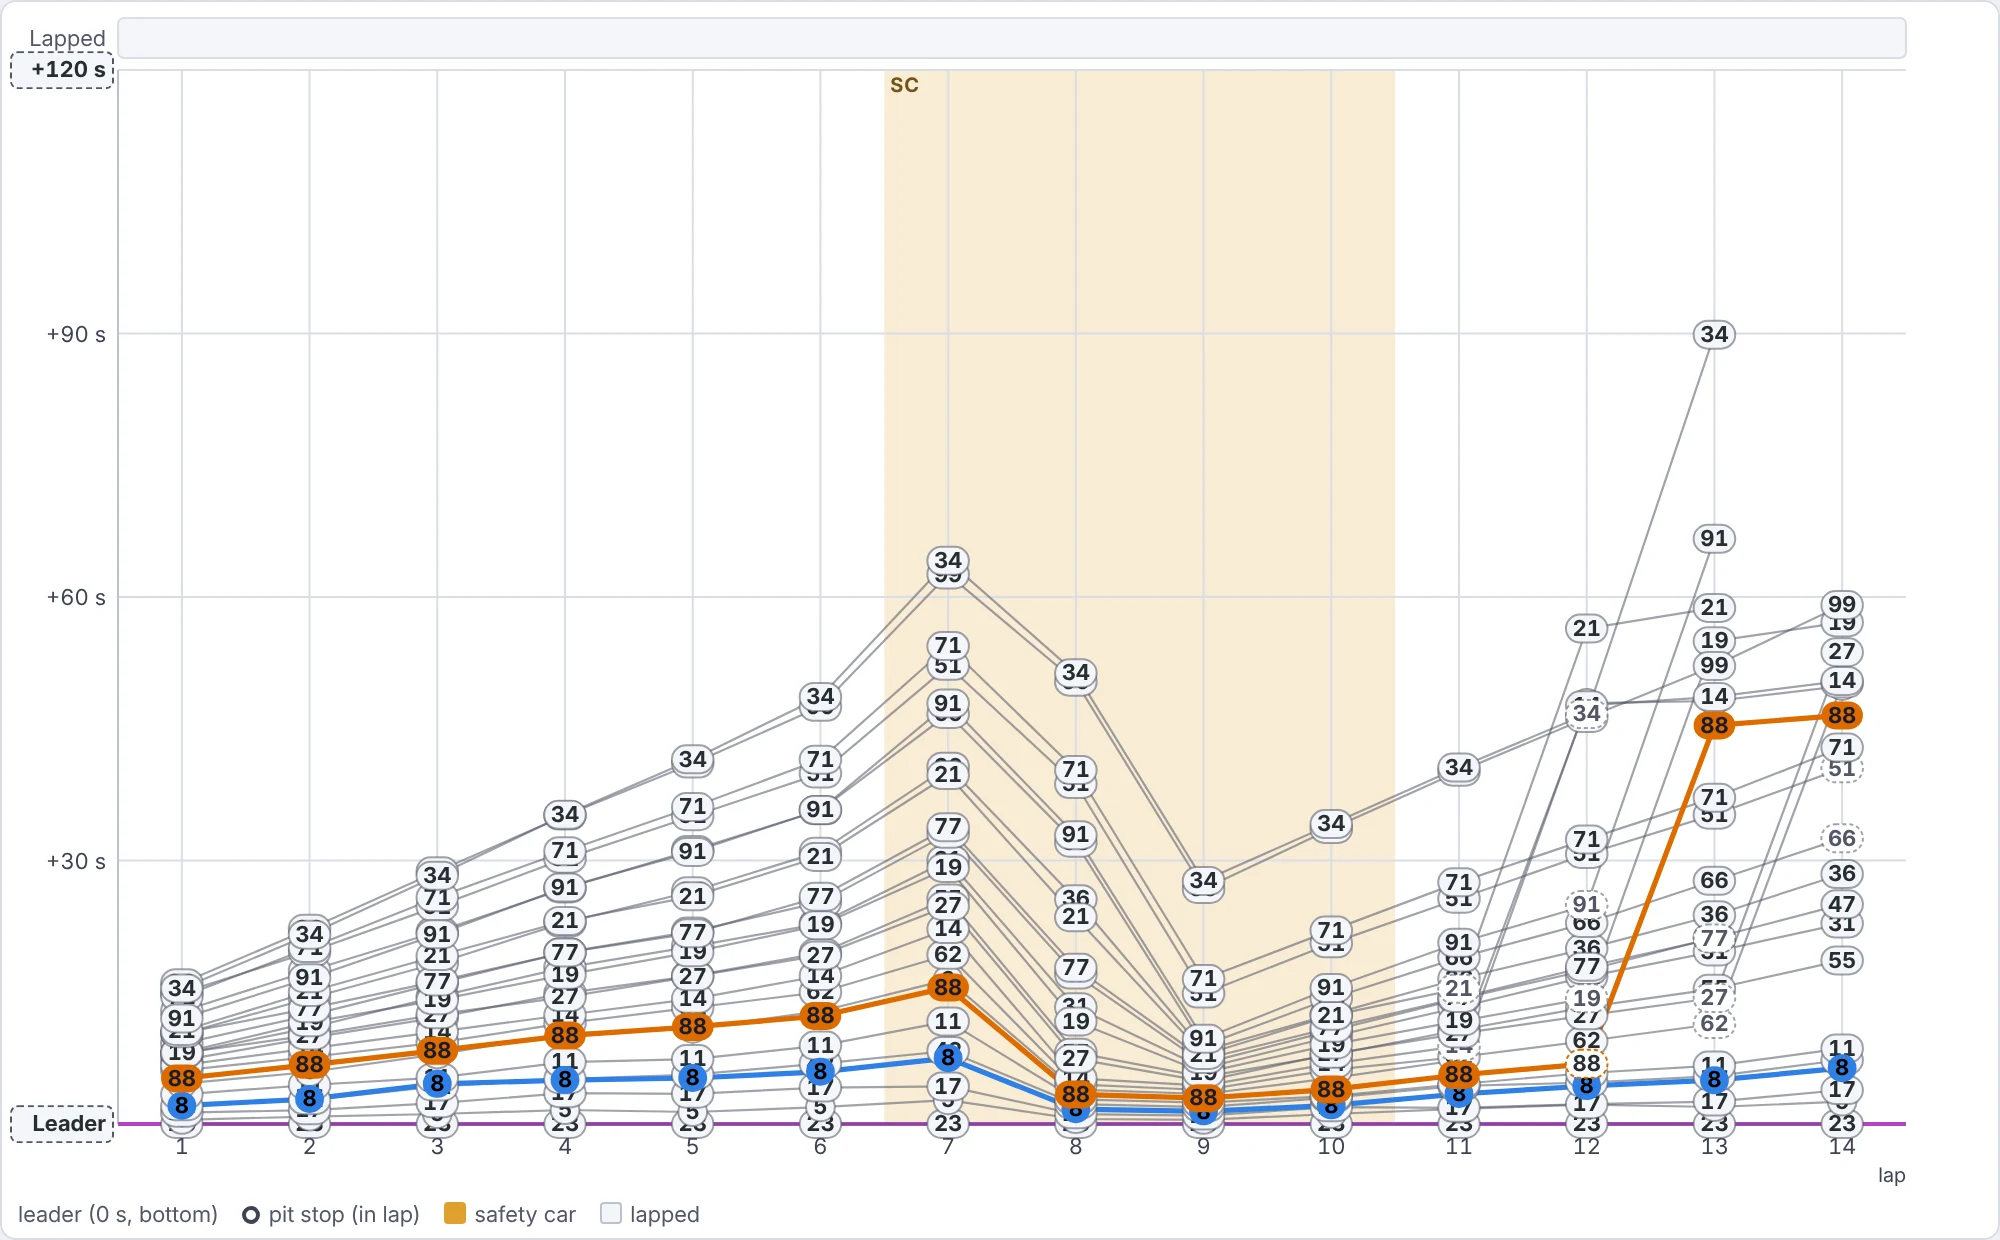
  • Position display
    Charts and analysis

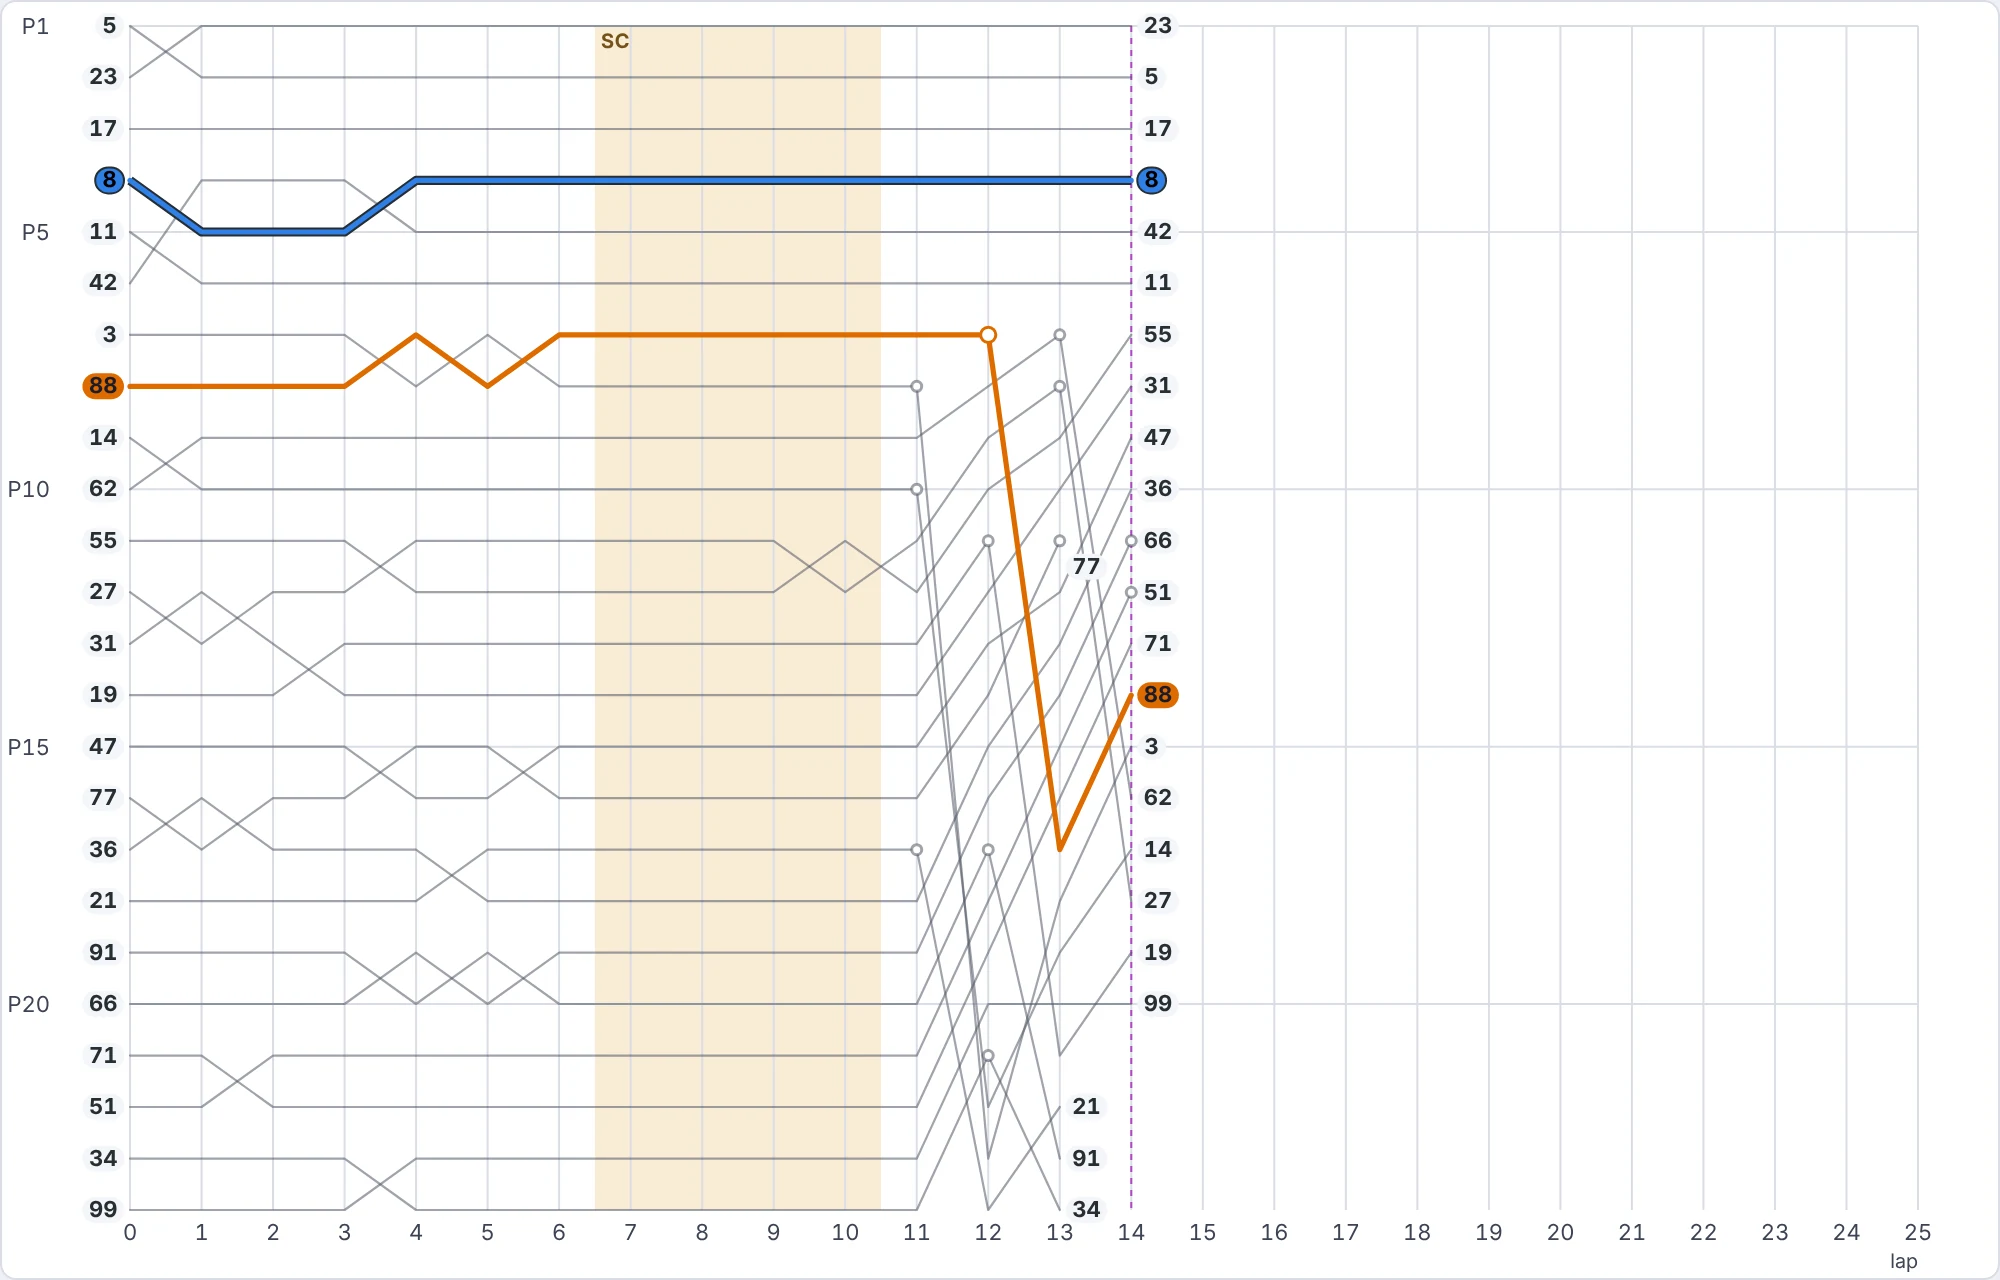
    Position

    Position by lap for every car, with the team’s cars highlighted.

    The whole race as one picture: starts, passes and stops.

  • TV feed display
    Around the garageNew

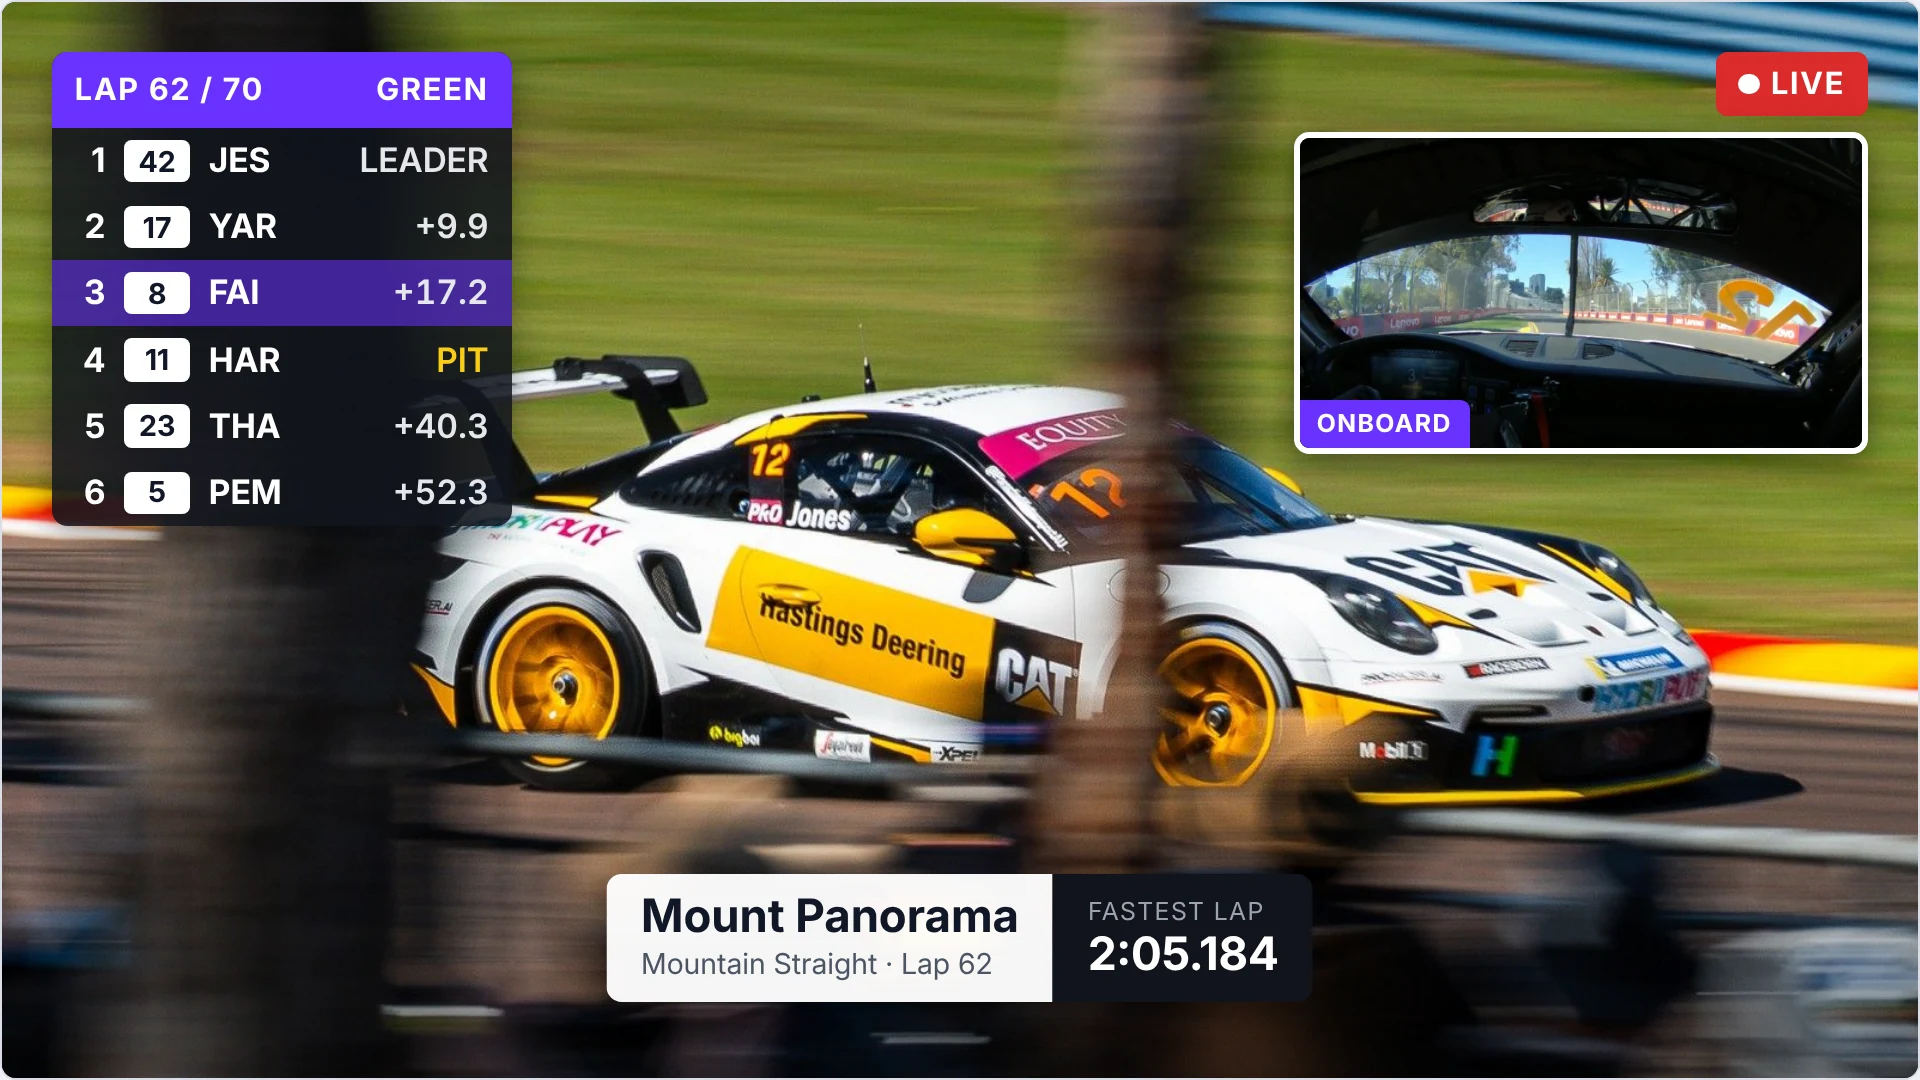
    TV feed

    A camera or capture device on the timing laptop.

    Show the circuit TV through a capture dongle, security cameras or overhead pit lane booms. Add as many as you like. Shown here with an illustrated on-track picture.

  • Strategy display
    Charts and analysis

    Strategy

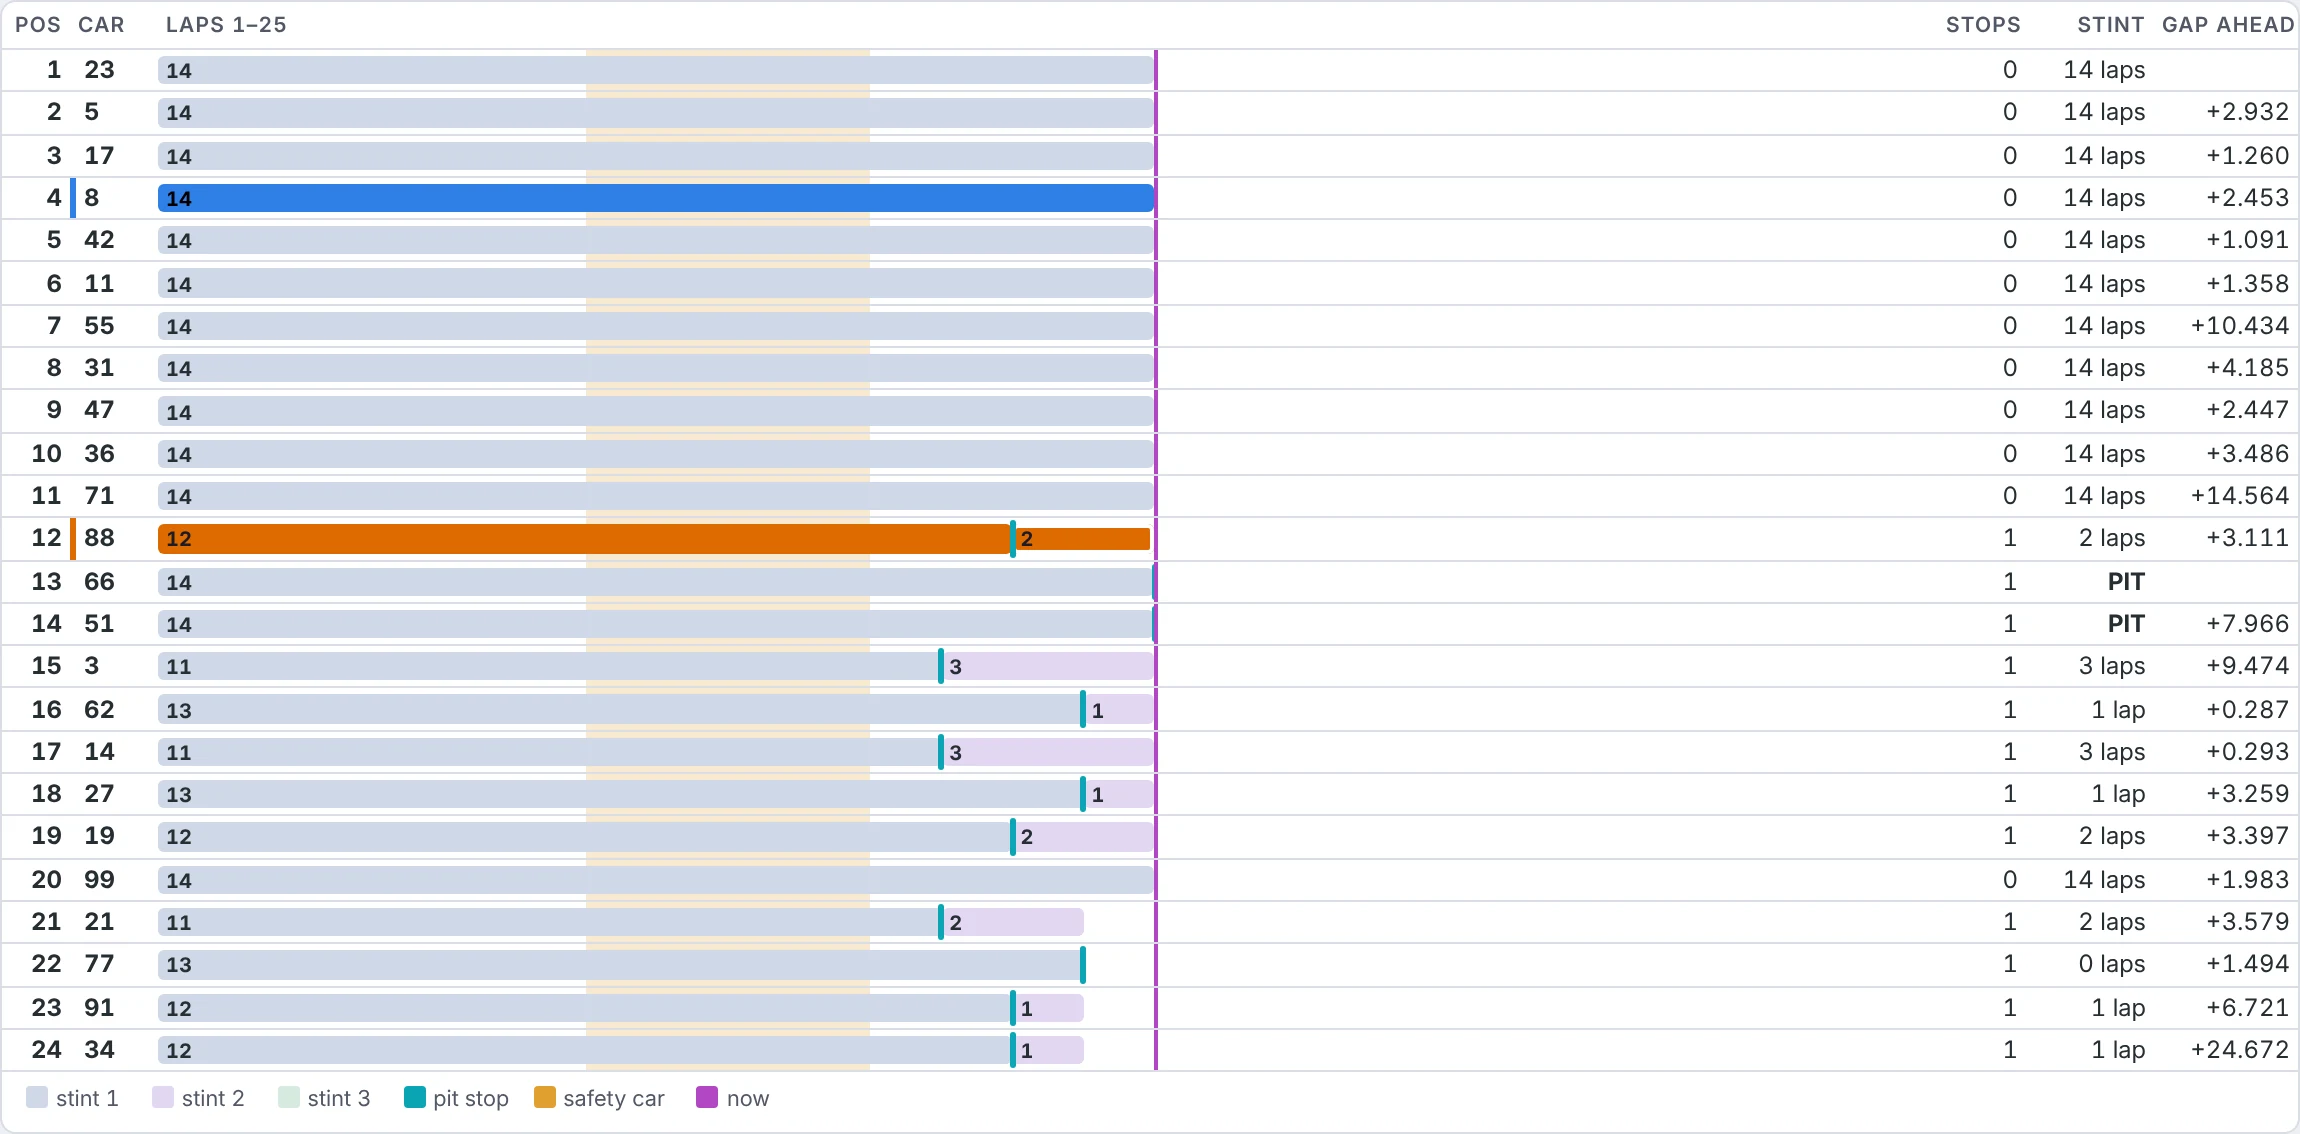
    One row per car, with stints as bars and the pit stops marked.

    Every car’s race at a glance: stint lengths, stops and gaps.

  • Raising average display
    Charts and analysis

    Raising average

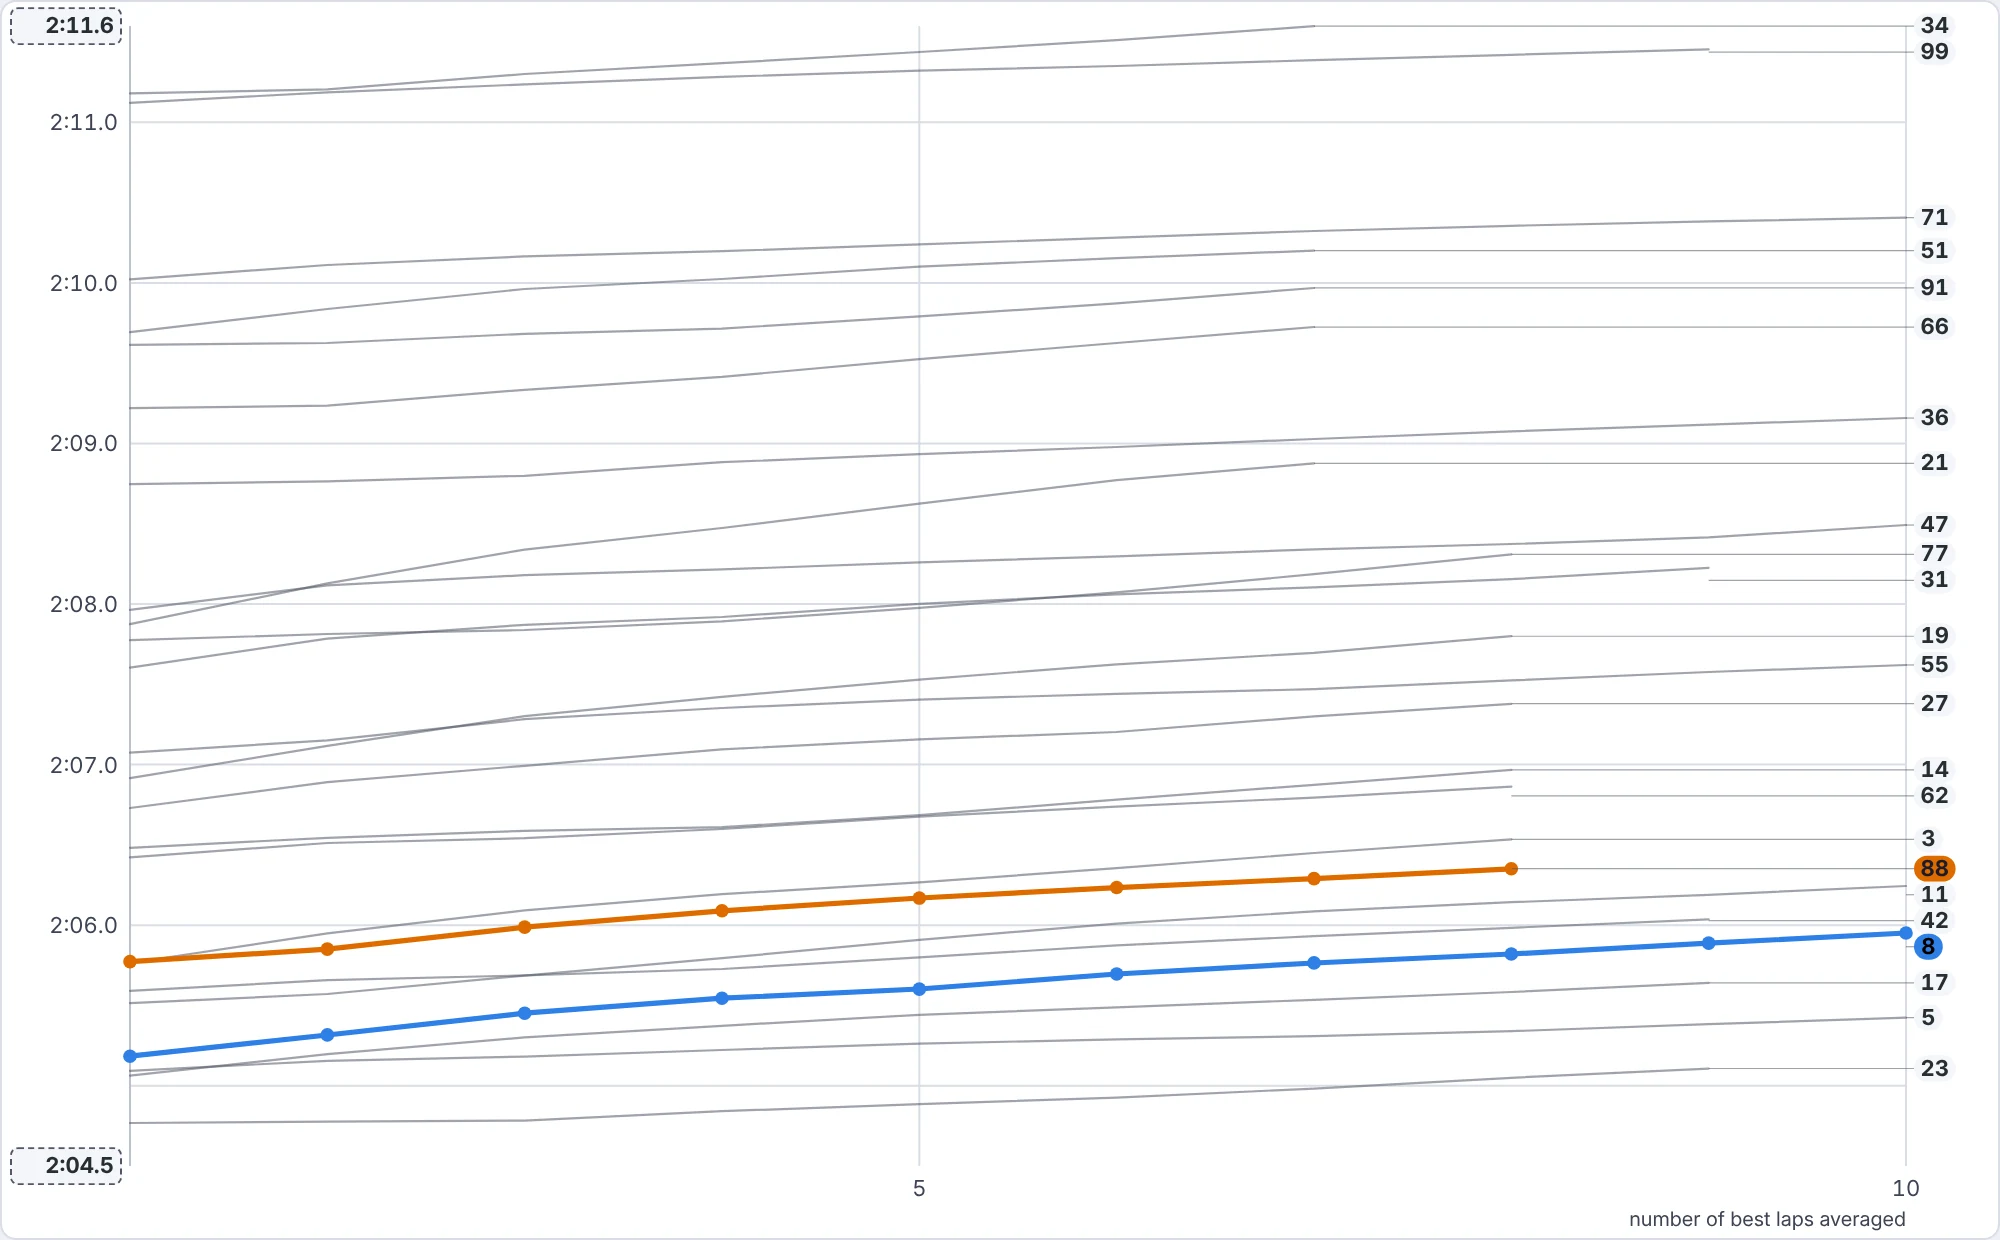
    Each car’s clean laps, fastest first, as a running average.

    A truer comparison of race pace than a single best lap. Lower and flatter is stronger.

  • Rival stop watch display
    Strategy callsNew

    Rival stop watch

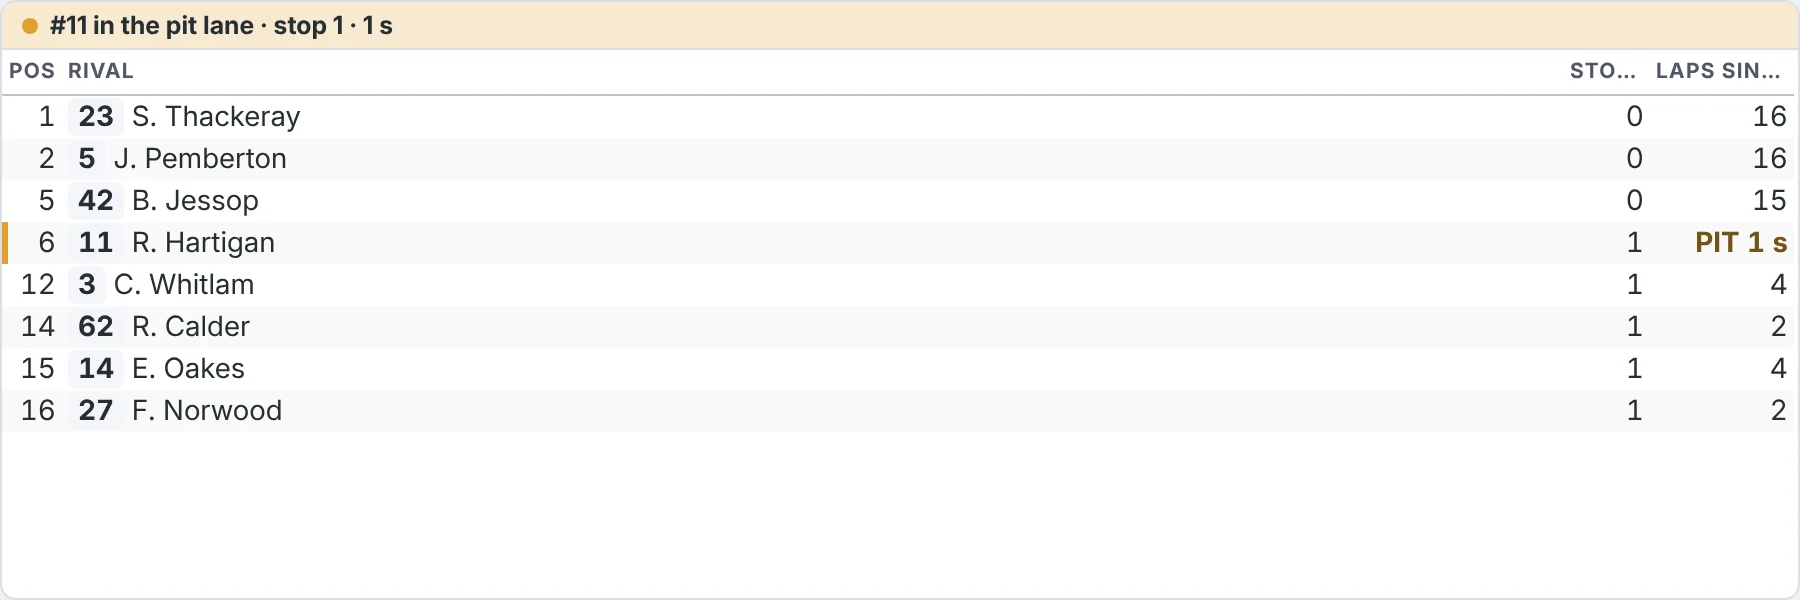
    Each rival’s stops this race and the laps since.

    A line appears the moment a rival goes into the pit lane, so you never miss a stop.

  • Starting grid display
    Race weekend

    Starting grid

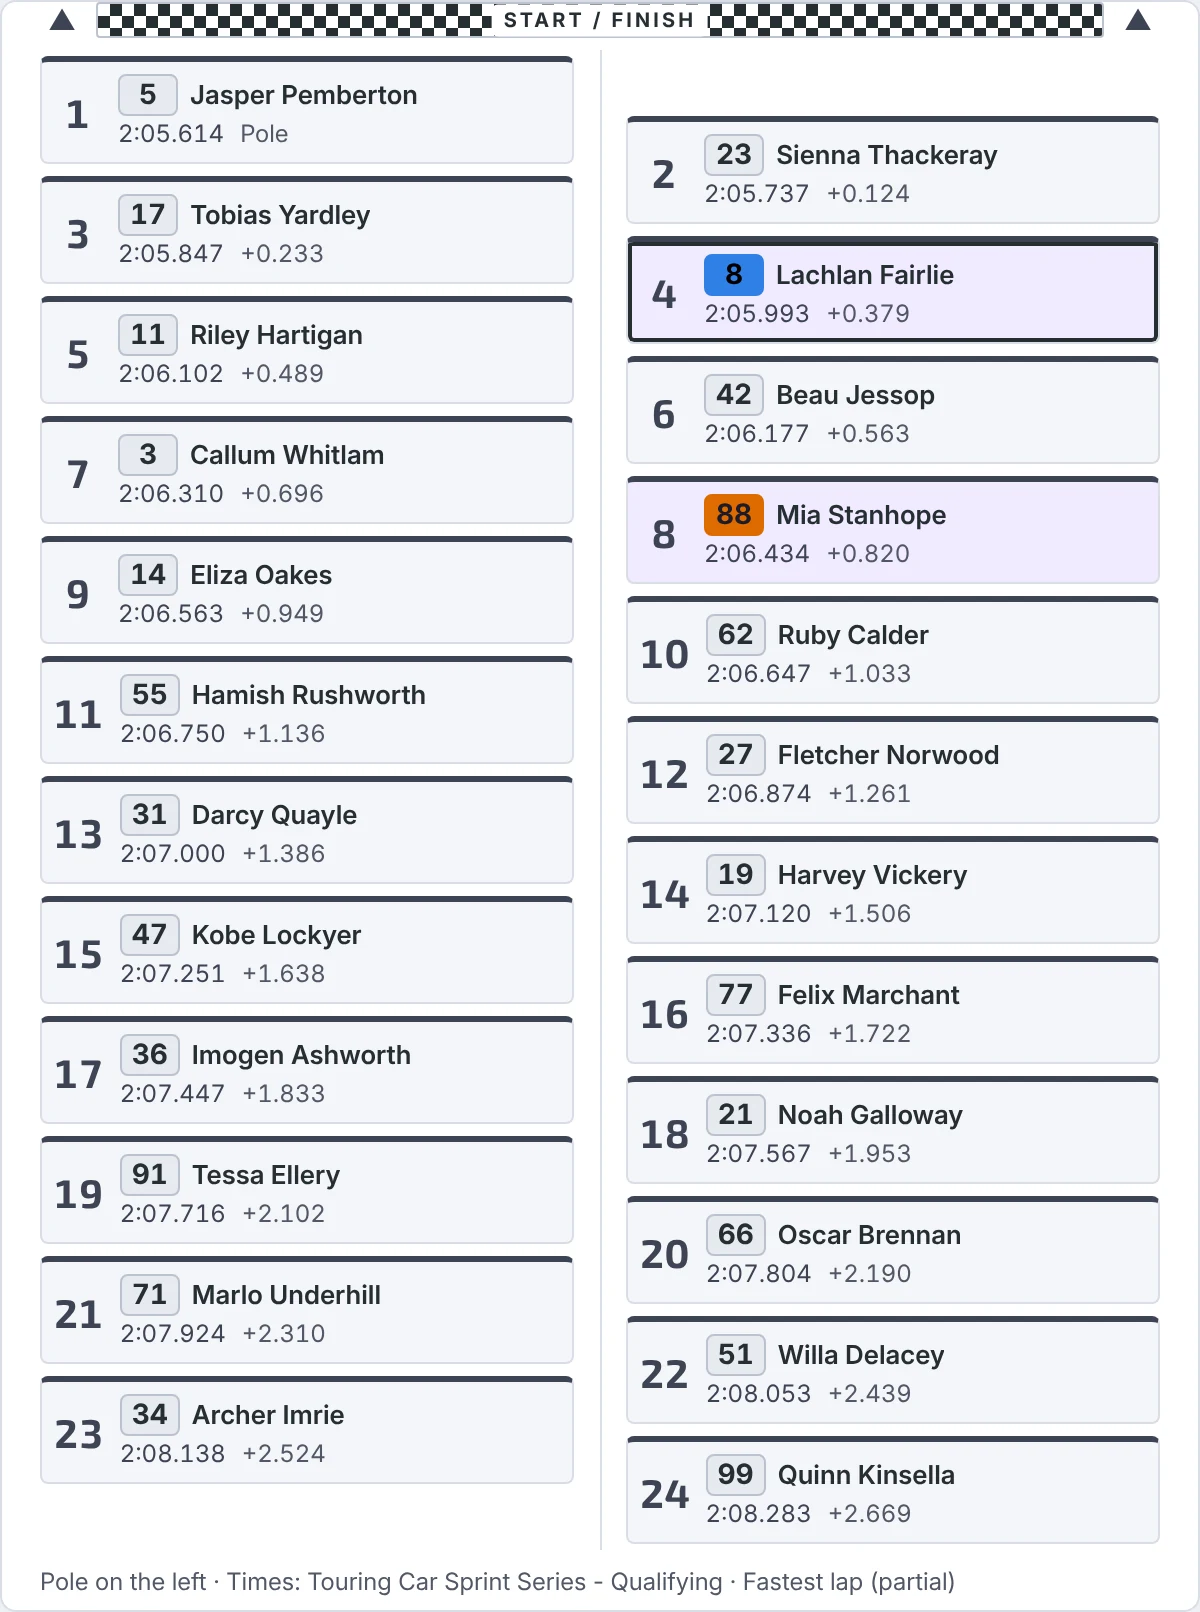
    The grid sheet: start line, boxes and pole side, from qualifying.

    Qualifying times and gaps for every car, laid out as it is on the track.

  • Browser display
    Around the garageNew

    Browser

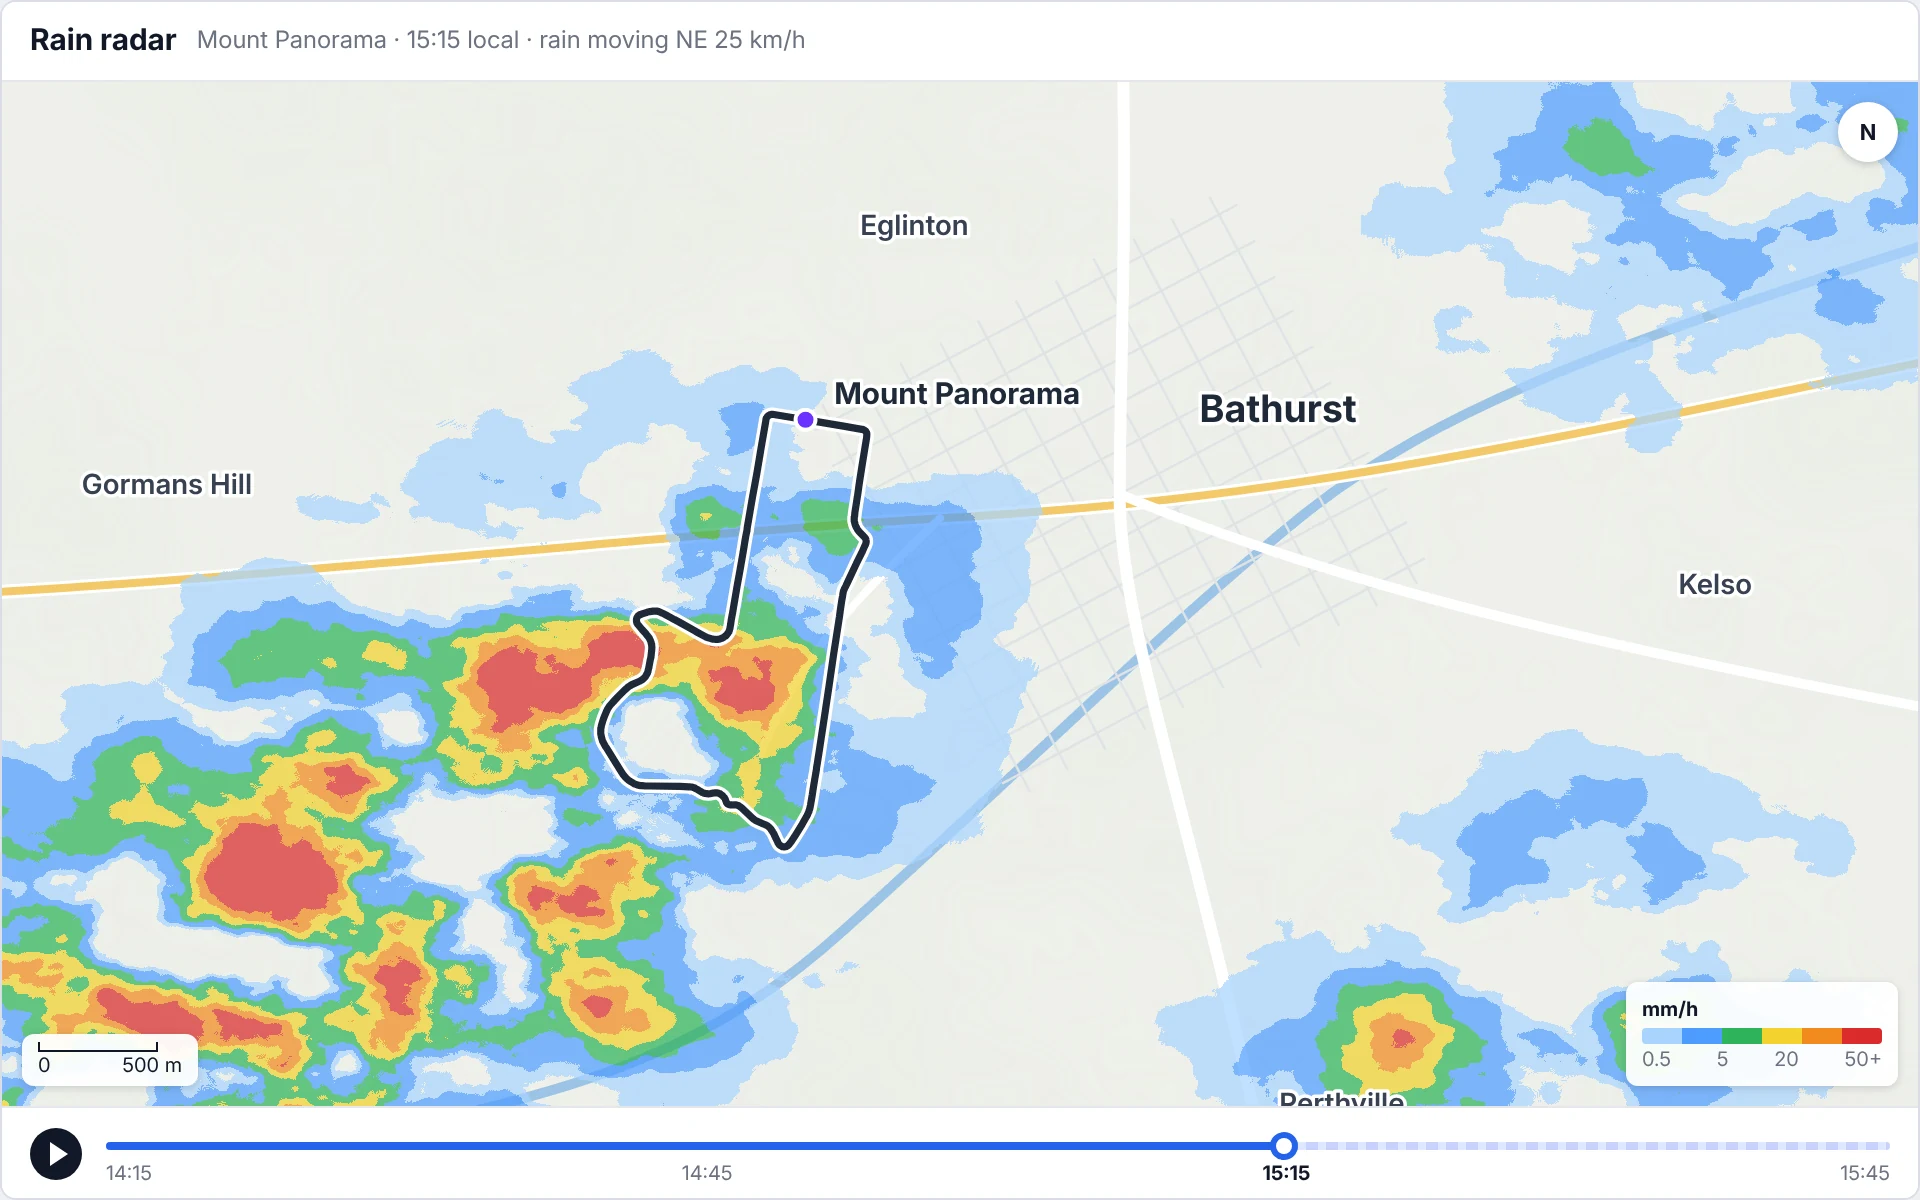
    A web page you choose, such as your favourite weather radar.

    Put any page you rely on into a layout. No timing data is sent to it. Shown here with a made-up rain radar.

  • Track limits and kerbs display
    Track and race control

    Track limits and kerbs

    Kerb hops, shortcuts and deleted laps, newest first.

    A count for every car, so you know who is close to a penalty.

  • Session clock display
    Live timing

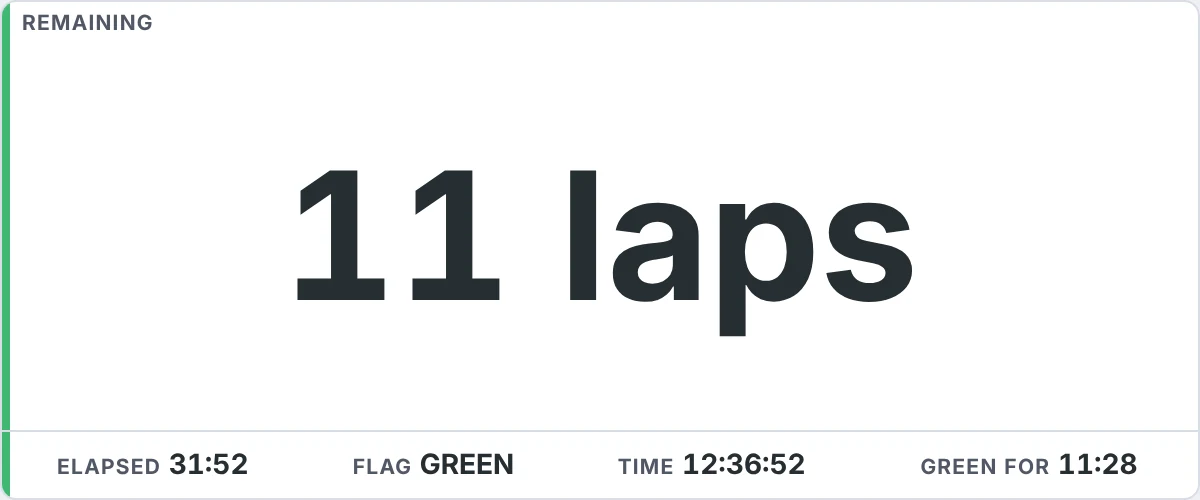
    Session clock

    Time or laps remaining, big, in the colour of the flag.

    Readable from across the garage, with the time of day at the track.

  • Green timer display
    Live timing

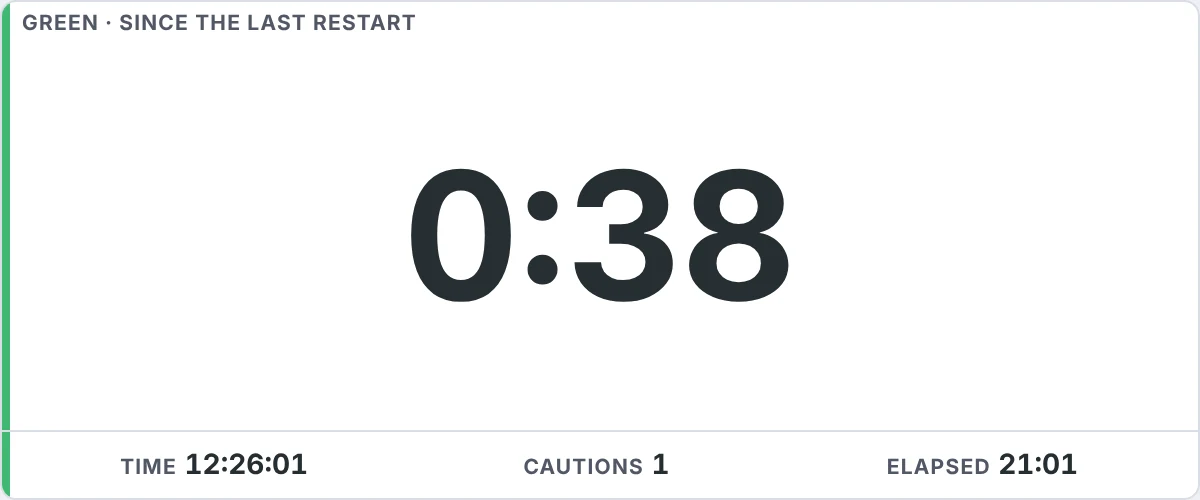
    Green timer

    How long the track has been green, and the time of day at the track.

    Useful for timing a stop or a push after a caution.

  • Gap ahead and behind display
    Live timing

    Gap ahead and behind

    Your car with the car ahead and behind.

    The fight around one car, on the road, overall or in its class.

  • Branding display
    Around the garage

    Branding

    Your team’s logo or name, or the Rovantra logo.

    On a light, dark or custom background, to fill a screen between sessions or frame a layout.

  • Phone QR display
    Around the garage

    Phone QR

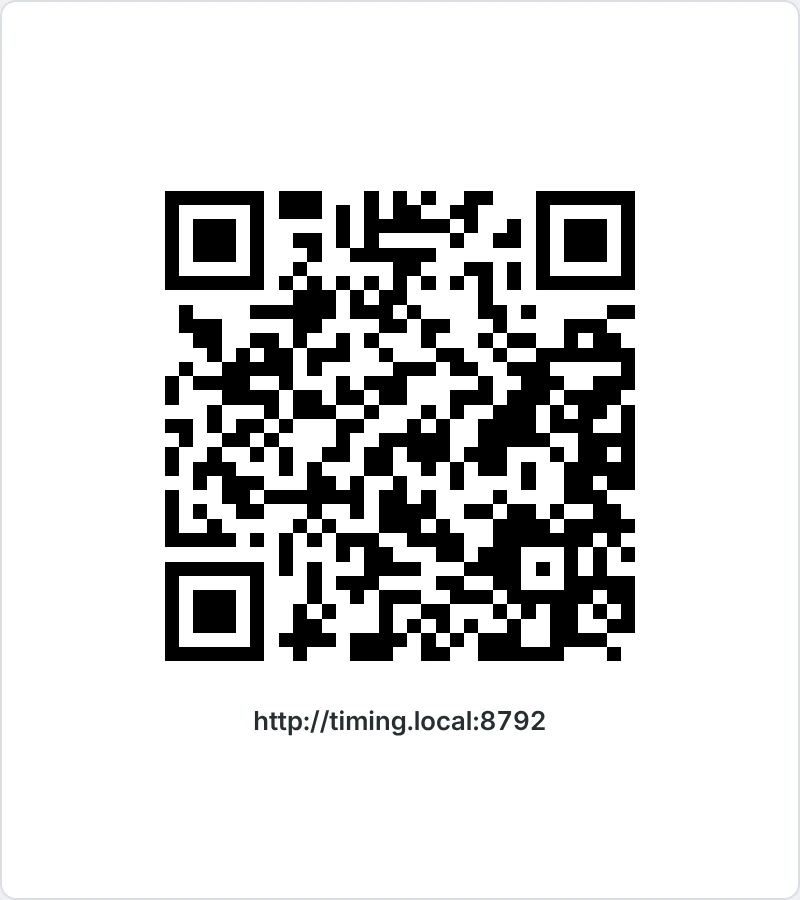
    A QR code of the timing laptop’s address.

    A phone on the same Wi-Fi scans it and opens the timing in its browser.

Captured from Rovantra Timing running a sample race at Mount Panorama. Drivers, teams and times are fictional. Predicted values are always marked in the program.

Who it's for

Built for Australian circuit racing.

Access at every level of motorsport, with a focus on national-level competition.

SupercarsSuper2Carrera CupSprint ChallengeTrans AmGTNational series
Pricing

One price per team.

Run Rovantra Timing on up to three timing laptops, with every phone in the garage following along.

You'll also need

Rovantra Timing reads the official Natsoft timing feed. The feed comes from Natsoft, not from us.

  • A Natsoft feed for each laptop running at the same time: the circuit's XML plugin on the circuit LAN, or a Natsoft Data and Display subscription
  • A Windows laptop for each timing screen
  • A local network (wi-fi router) for phones in the garage

Natsoft feeds are arranged and paid for by your team directly with Natsoft or the circuit. They are not included in the Rovantra Timing price.

Prices are in Australian dollars. Teams outside Australia pay the price without GST.

Free 3-day trial

Put Rovantra Timing in your garage.

Try it at your next round. No card needed. Sign up, confirm your email, and run it on your timing laptop for 72 hours.